ArcWatch: GIS News, Views, and Insights
November 2010
Werner Enterprises Keeps on Truckin' with GIS
By Karen Richardson, Esri Writer
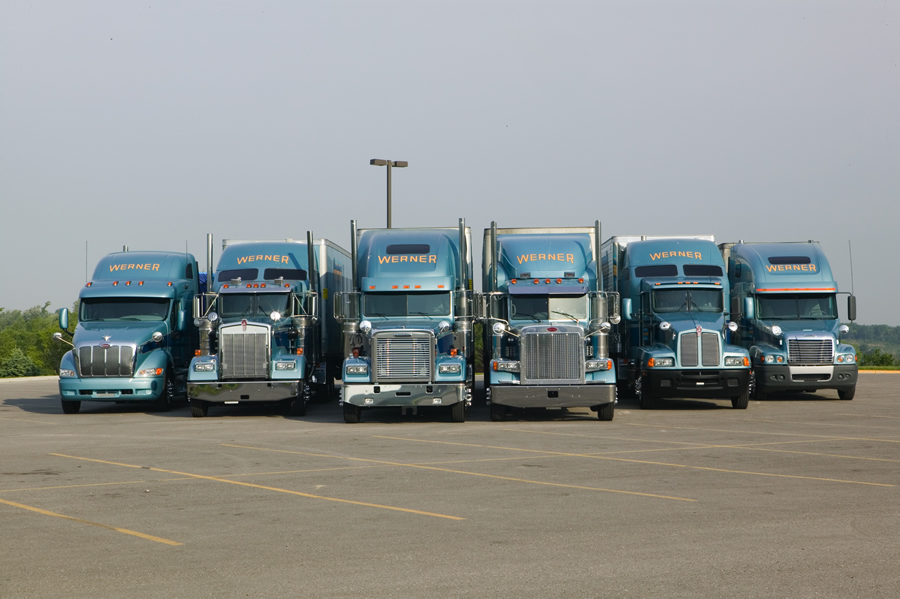
The fleet of 9,000 Werner Enterprises, Inc., trucks deliver food, beverages, and manufactured goods.
In 2008, Werner Enterprises Inc., one of the five largest truckload carriers in the United States, realized that seeing is everything. A stretch of Interstate 80 in Iowa flooded that year, shutting a portion of the freeway and creating a 110-mile detour for two days. Werner needed to find out which trucks in its fleet were diverted, since the drivers had to avoid the closed portion of the interstate, incurring out-of-route mileage.
"At the time, there was no way for us to see specifically which trucks were affected," says Scott Andersen, manager of logistics analysis and GIS at Werner. "The best we could do was find every truck, one at a time, that might have traveled between Omaha, Nebraska, and Chicago, Illinois, at some point in time. This is not an easy task when you are sifting through drive records for 9,000 trucks."
Two weeks later, Werner's employees found the information, but by then, it was too late. "We didn't recoup any of our costs," says Andersen. This was an eye-opener for the company, and Werner staff wasted no time finding a technology that could help them see their trucks on the road at all times—before the next business interruption occurred.
Today, GIS technology from Esri helps Werner Enterprises keep track of its fleet of more than 9,000 trucks. Using ArcGIS and a tractor tracking device traditionally used by long-haul trucking companies, Werner can now bill mileage to customers more accurately and route its fleet more efficiently.
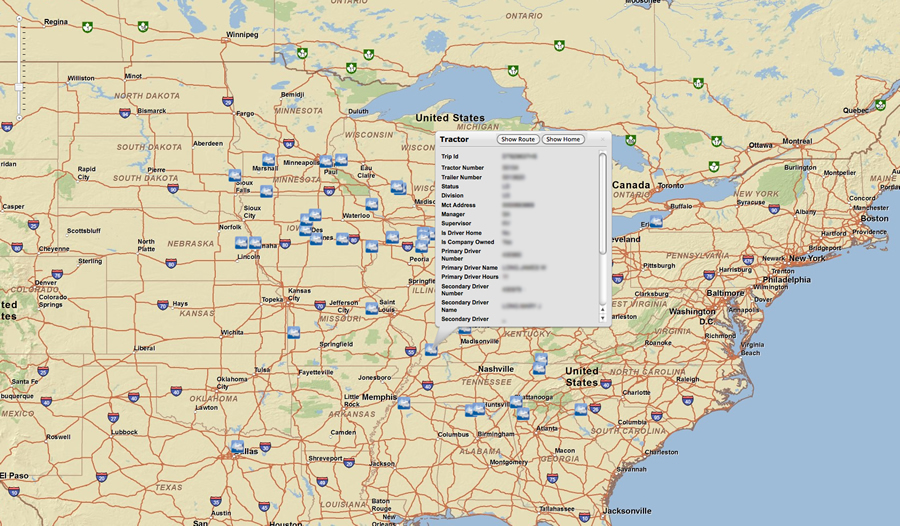
Using ArcGIS technology, Werner can see where the company's trucks are located anywhere and at any time.
A Vision for GIS
Every day, thousands of Werner Enterprises 18-wheel trucks and their drivers are on the move, delivering food, beverages, manufactured goods, and other freight across the United States. While staff at Werner uses a traditional tracking device tied to communication networks to deliver information about the trucks on the road back to the main office, it could not visualize where those trucks were located. Displaying the trucks' specific locations, preferred fuel and maintenance stops and Werner facility locations on a map would provide up-to-the-minute information to help manage this vast inventory of trucks.
Anthony DeCanti, vice president of Werner, understood that organizations running fixed assets like the large transportation fleet at Werner need to carefully manage business costs. Knowing where trucks are located allows companies to be prepared for anything: inclement weather, load changes, or vehicle break downs. DeCanti knew about GIS technology and recognized that using GIS software to see exactly where Werner's trucks were located would help the company more accurately plan shorter routes and the best locations to stop for fuel, rest, maintenance, or emergencies.
DeCanti directed Werner's IT department to research available GIS solutions, and after looking at many options, the company adopted Esri GIS technology. "We felt there wasn't a better solution out there for managing the large amount of information we had to manage, and we were able to integrate GIS into our existing core business processes," says Andersen.

When a rock slide occurred in North Carolina and closed a portion of Interstate 40, Werner staff was able to see all the routes feeding into that section of freeway and find the trucks affected by the closure.
Putting Werner in the Driver's Seat
Werner implemented Esri's ArcGIS Server, which integrates geographic location into business data to better manage information. Werner uses the software to keep track of its very large fleet and outfits its trucks with transmitters that provide two-way text and data communications between the vehicles and Werner's headquarters in Omaha, Nebraska. The data includes the latitude and longitude for each truck. When transmitted back to the main office, the latitude-longitude is geocoded and the trucks' locations are seen on interactive maps created using ArcGIS Desktop.
Keeping the Business Running
When a rockslide occurred in 2009 on North Carolina's Interstate 40, Werner was ready. With ArcGIS, the company was now able to display the information it needed on a map instead of looking through reams of records by hand. Staff used ArcGIS to find and identify the trucks that had historically passed the particular road segment affected by the slide. This information was then cross-checked with which trucks were actually out on the road at the time as determined by real-time data received from the trucks' transmitters. Hundreds of customers were notified of the disruption in service as well as any charge that would be incurred because of additional mileage. This process only took the company a few days to complete.
"We went from not being able to identify the trucks that were affected to having more than 90 percent accuracy," says Andersen. "There was no way we could have done that before. And to top it off, the analysis was very fast."
Today, data is readily available by clicking a truck icon on the map to access information quickly, including where the truck is heading, the driver's name and the hours or road time he or she has, and what type of freight is being carried. This is crucial for scheduling trucks and drivers. It is also important in ensuring that drivers are not given too many drive hours, trucks are on time for scheduled maintenance, and routes are as optimized as they can be. Andersen says that consolidating all aspects of on-road operations into the visual and intuitive GIS environment has significantly streamlined Werner's workflows.
"By knowing exactly where our assets are at a given time and comparing that to the origins and destinations of loads we have in our pipeline, we can better allocate our resources and truly understand the costs of doing business," he says.
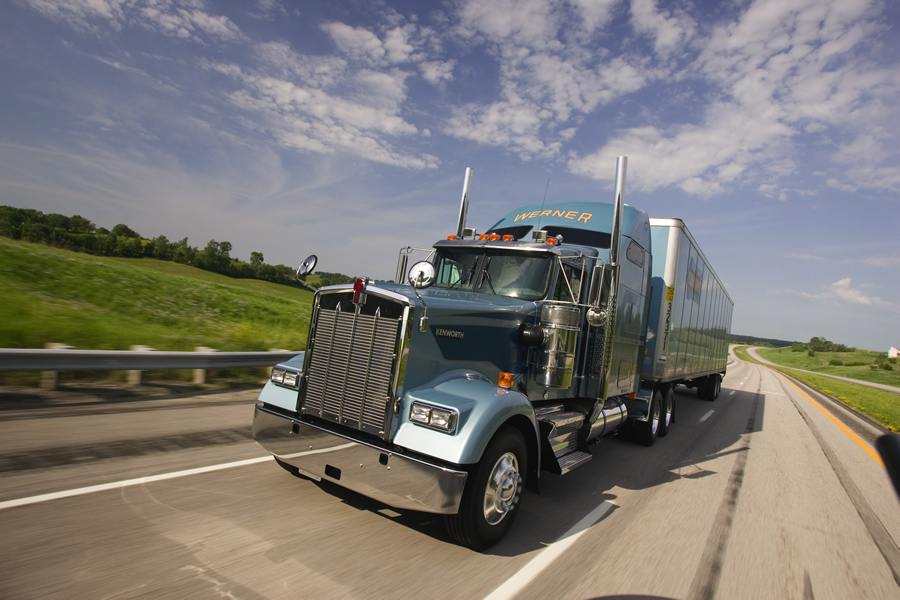
Using GIS helps Werner save time and money and improve drivers' safety.
The company is upgrading from ArcGIS Server 9.3.1 to ArcGIS Server 10, integrating GIS data and maps more completely into its enterprise workflow. Werner chose to implement GIS over the Internet so data could be easily shared throughout its organization using standard Web browsers to access the maps and data. Web applications will be used by dispatchers and driver managers.
Corporate Agility Leads to Profitability
Having access to this information and being able to respond to changes in operation are imperative when running a transportation and logistics business. There is little room for error. And being agile, thanks to better access to information, helps the company run profitably and deliver superior performance to customers.
Seeing where the trucks are located also allows Werner to run reports that calculate geographically based information, such as mileage, how large a load a truck can carry to a specific destination, and where drivers need to stop for such things as refueling or deliveries. With this information and the ability to ask questions of the data, Werner staff can run different scenarios and find the best solution that will save the company time and money and keep drivers safe. Werner can now utilize its trucks and drivers in a smart way, reducing costs.
While Werner initially used GIS to gain better insight into fleet operations, today the company uses ArcGIS in many areas of its organization. Having spatially enabled its fleet for display on a map, Werner is further leveraging the analytic power of GIS. Analyzing logistics and common geospatial services throughout the enterprise, such as geocoding, finding the closest important location, and generating and summarizing data within drive-time buffer areas, are all activities the company can do with GIS. Visit Esri's GIS for Logistics Web page to learn how GIS helps logistics and other companies manage their fleets.