ArcWatch: Your e-Magazine for GIS News, Views, and Insights
November 2011
Grabbing Hurricane Irene by the Tail
Insurers around the World Use Interactive Mapping and Modeling to Understand Impacts of Hurricanes and Other Disasters
Because of the millions of people in its path along the East Coast of the United States, the wrath of Hurricane Irene turned into a major news story this past August.
The 2011 Atlantic Ocean hurricane season in the United States, which was more active than normal, also churned up Arlene, Bret, Cindy, Don, Emily, Franklin, Gert, Harvey, Katia, and 10 other storms.

Esri's Mark McCoy explains how ArcGIS helps insurers monitor catastrophic events such as hurricanes, floods, and wildfires.
Hurricanes and other natural disasters caused more than $265 billion in damage globally during the first half of 2011. While emergency response and government organizations play important roles in responding to these disasters, in many cases, it is insurance companies that cover the costs of rebuilding people's houses and businesses. Insurers must understand the risk associated with the policies they cover and ensure that they can pay claims when submitted.
Esri writer Karen Richardson interviewed Mark McCoy, the insurance industry solutions manager for Esri, about how GIS data and mapping technology is being used to plan for events like hurricanes to help people rebuild their lives after a catastrophe occurs.
Richardson: Why is location intelligence so important in the insurance industry?
McCoy: Understanding the likelihood—or, as they say in the insurance business, the risk—that an event such as a hurricane, flood, or earthquake could occur and damage property or harm people is at the heart of what insurers do.
Understanding risk at a given location has two primary benefits. First, insurers can use this information to make certain their customers are as safe as possible (think about trimming brush and trees around houses and other structures in burn areas) and that they carry the appropriate coverages for any catastrophe that might affect that location. Second, insurers can accurately rate the risk to ensure they are collecting appropriate premiums for the losses that are likely to be incurred.
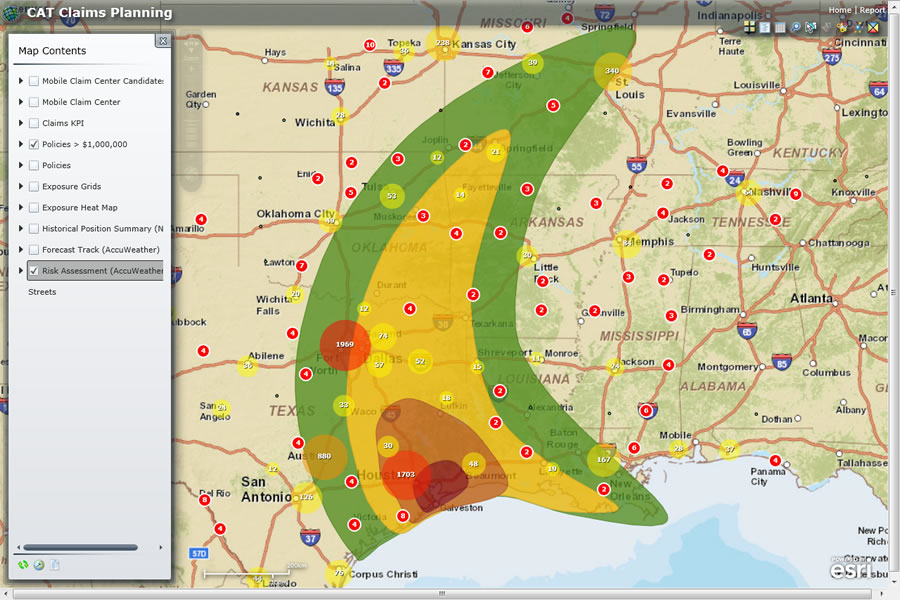
Viewing wind speed on a map helps insurers monitor how much they must pay based on the intensity of the storm at each location.
Location intelligence helps insurers better understand how to respond to customers by tracking, ahead of time, the severity of an event such as a hurricane. They can view information about the storm conditions, along with policyholder concentrations in the affected areas. This allows carriers to make timely decisions to ensure they have adequate resources available to service their policyholders at a time when they are needed most. Hurricane Irene, which caused severe flooding and wind damage in states such as New Jersey, New York, and Connecticut last August, exemplifies why it is important to know the exact location of both insured properties and storm intensity. The insured loss for that natural disaster will likely be more than US$2 billion. That means there will likely be hundreds of thousands of claims to process. Knowing where policyholders are located and the specific path of the hurricane, insurers can accurately identify customers in the areas that were impacted by Irene. This is important, because claim severity—the monetary amount of the claim—can vary significantly depending on the intensity of the storm at the location of each claim.
Irene is a great case study. The hurricane's intensity varied as it progressed across the northeastern United States, dissipating from a category 1 hurricane when it made landfall near Cape Lookout, North Carolina, to a tropical storm as it moved inland to New York, New Jersey, and Connecticut. In North Carolina and Virginia winds were strong enough to cause significant structural damage to homes. In parts of the Northeast, including New Jersey, New York and Vermont, winds were relatively weak but flooding caused substantial damage. In states like Rhode Island, Massachusetts and Connecticut there were significant volumes of minor claims from food spoilage and tree debris removal. Being able to determine exposures in different areas as well as knowing the likely severity of the damage allows insurers to proactively plan for potential claims volume and ensure they have resources with adequate training available to assist with the influx of claims.
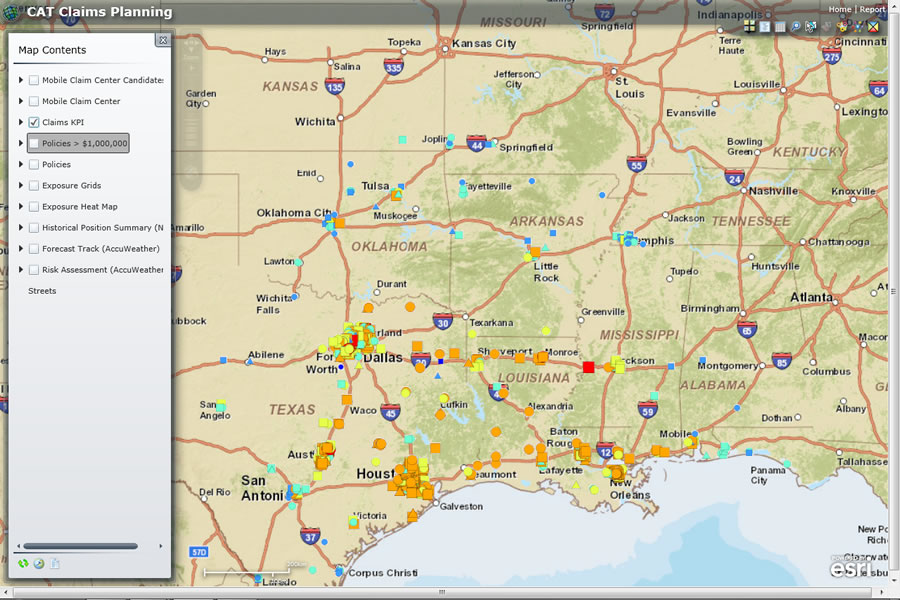
Viewing claims on a map allows insurers to proactively plan for the volume of potential claims and ensure they have staff with adequate training and other resources available to assist with an influx of claims.
Richardson: What is the best way for insurers to integrate location information into their claims workflows?
McCoy: Many insurers use ArcGIS Online, a cloud-based geospatial content management system from Esri that anyone can use to create and share geographic content and build applications, then share them at no cost.
ArcGIS is also used on servers, desktops, and mobile devices at insurance companies to create applications that staff can use throughout their organizations. Tracking real-time events like Hurricane Irene and viewing geocoded policy locations simplifies and improves the accurate identification of customers in impacted areas. Insurers use this information to call on policyholders that may have experienced losses, provide immediate assistance including hotel vouchers and rental cars, and calculate what their exposed loss may be in real time.
Richardson: How do insurance agencies incorporate mapping of real-time events such as hurricanes into their claims management process?
McCoy: Amica Mutual Insurance, an insurer headquartered on the East Coast, uses real-time weather warnings brought in as a service to ArcGIS. (Read this article about Amica's use of ArcGIS). These weather warnings include radar loops that display the strongest parts of the storm. This allows claims managers to see, as the event is happening, which policy locations the storm has affected. By viewing this on a map, the path of destruction becomes very clear, very quickly.
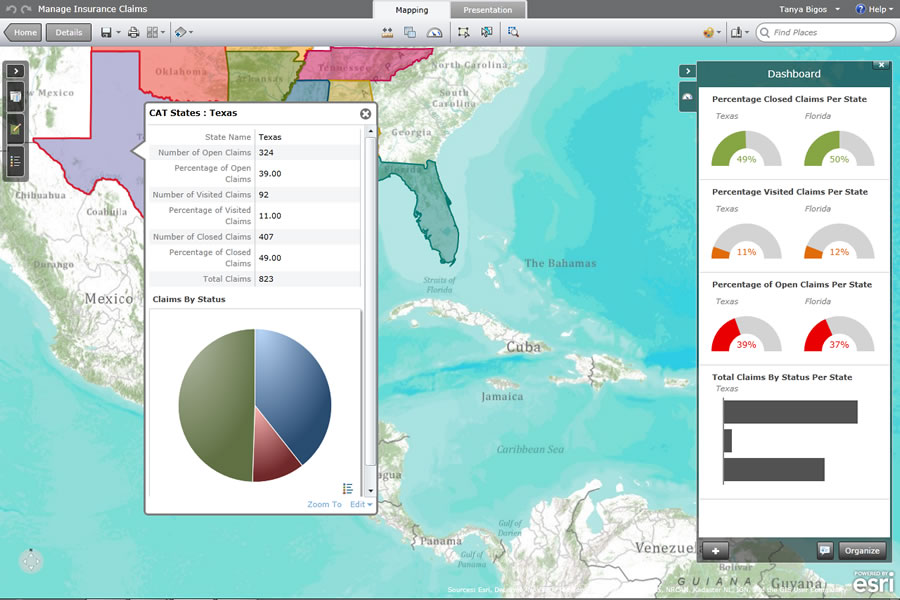
GIS provides analysis and oversight for insurers. Using this custom-built dashboard, they could view the status of claims after the Texas wildfires.
Once the storm has passed, the insurer's staff plots claims on a map, as they are reported, using ArcGIS. This immediately gives claims managers the precise areas of damage to decide what resources they need to help their policyholders and quickly start the claims process.
Richardson: In many instances, catastrophic events that cause so much insured loss are insured by reinsurers. Do they use location and GIS to help with their claims management process as well?
McCoy: Absolutely. Reinsurers provide insurance to insurance companies. Using ArcGIS Online for cloud-based mapping and analysis, it is easy to connect with clients around the world and share data and analysis.
Willis Re, one of the largest reinsurers in the world, uses ArcGIS to do exactly this. Willis Re's clients, insurance companies, log on to its system, called eNCOMPASS Online, to visualize all policies that were affected by a catastrophe such as Hurricane Irene. After Willis Re's clients find and select those polices, descriptive information, such as the property owner and the value of the policy, can be viewed and analyzed further if necessary.
Richardson: The use of social media during disasters like Hurricane Irene has received a lot of media attention lately. Do insurers use social media to assist with their catastrophe response?
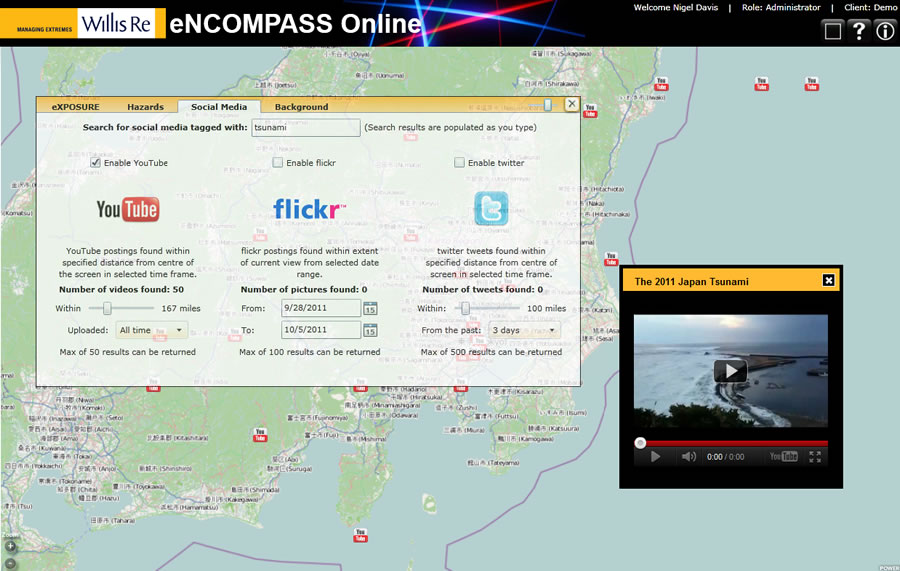
Willis Re's eNCOMPASS Online allows clients to map social media, making crowd-sourced data available for quick analysis of what is happening near their policyholders.
McCoy: We are living in a time of unprecedented information availability. Insurers used online interactive maps provided by Esri or created their own on ArcGIS Online during Hurricane Irene. Willis Re is again a great example. They have been pioneers in mapping social media and making crowd sourced data actionable.
ArcGIS allowed them to view social media posts in conjunction with frequently updated storm tracking information from weather services and earthquake activity from the USGS. Alongside detailed local street and topographic maps, this provided a new way to assess local conditions in the wake of major tropical storms and earthquakes across the globe during 2011. By turning on the geolocation feature of social media platforms like Facebook, Twitter, Flickr, and YouTube, people can annotate their posts with exact locations. While one or two of these posts may not be alert worthy, a large number coming from one location can indicate that there is a severe problem or many people are affected. A scattering of many posts distributed across a vast location can be analyzed by creating a heat map in ArcGIS of those posts, which can more easily display clusters of information for quicker analysis. Using this information, insurers might better prepare field crews to respond to situations such as impassible roads, power failures, or other issues that may affect their service to clients.
Richardson: Do you expect that the trend of using mapped information to more quickly and accurately process claims will continue?
McCoy: Yes, I do. Applications like ArcGIS Online provide an analysis and oversight solution for insurers. ArcGIS Online combines authoritative data from storm track modeling and weather services with social media to provide a complete picture of the widespread impacts of natural disasters. The insurance industry can use the most up-to-date information, historical data, and what-if analysis to understand and manage exposure while providing better service to its clients.
Visit esri.com/insurance to learn more about GIS for insurance.