Bringing Geographical Analysis to Harvard
By Peter K. Bol, Director of the Center for Geographic Analysis, Harvard University
Last May, Harvard University established the Center for Geographic Analysis (CGA). With that, the university committed itself to a discipline it had ignored since closing the Geography Department more than 50 years ago.
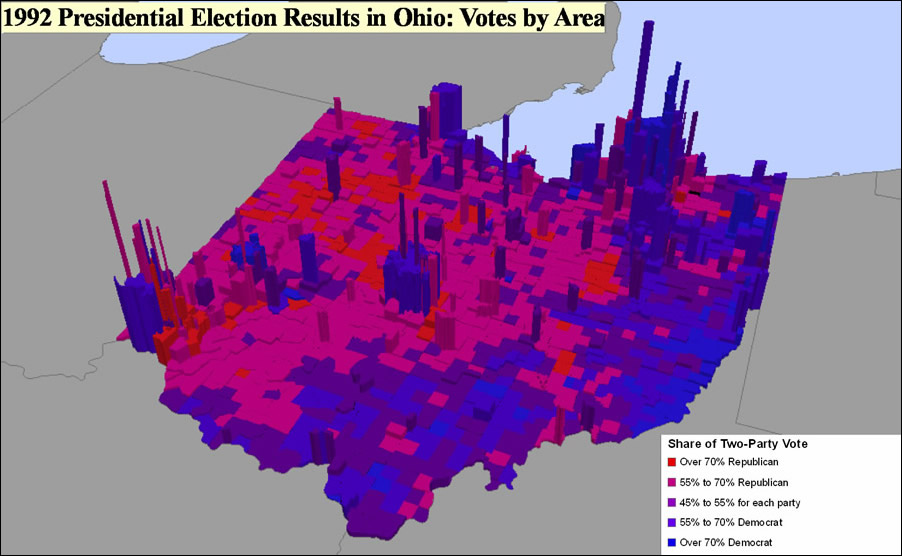 The Center for Geographic Analysis at Harvard University created a tool that allows the analysis of voting behavior based on demographics and geography. |
The center was created for a simple reason: The faculty needed help. Today at the university level, geography has a role to play that aims to understand our world globally, see how developments in separate places impinge on each other, model the consequences of human activity and natural events, and make this knowledge accessible to scientist and humanist alike.
For the historian, epidemiologist, economist, urban planner, archaeologist, and environmental scientist, geography today provides the technological means to analyze things spatially. As researchers and teachers, faculty are realizing the value of seeing the spatial relationships between social and natural phenomena, being able to share data across disciplines, and offering students an integrative way of thinking about the world around them.
But for most faculty and students, it's still a challenge to work with large datasets that have spatial attributes; remote-sensing imagery; and, most of all, the constantly advancing geographic information system (GIS) software packages. That work, along with georeferencing historical maps and monitoring spatial events in real time, highlights the need for the Center for Geographic Analysis.
Projects Underway
Today the Center for Geographic Analysis is working to
- Increase our access to quantitative spatial data, improve our ability to transform raw data into forms useful in spatial analysis, and stay up to date with developments in software technology. We already have a foundation: The Harvard Map Library, one of the nation's greatest collections, has begun digitizing some of its collection. The Harvard Geospatial Library at http://hgl.harvard.edu is a fast growing online collection of spatial datasets.
- Improve our ability to teach GIS and spatial analysis at both the undergraduate and graduate levels across the university. This year, we have introductory courses in the School of Design, the Faculty of Arts, and School of Public Health, and we are launching a new course in spatial statistics.
- Provide better support for those who wish to apply spatial analysis in their research. GIS analysts in the center are helping faculty across the university, as discussed below.
- Contribute academically to the development of geospatial analysis and its applications in the natural sciences and social sciences by appointing faculty. This is crucial to our long-term success. In the near future, we hope to appoint a senior geographic information science faculty member who can direct projects that require GIS analysis and do research on GIS itself.
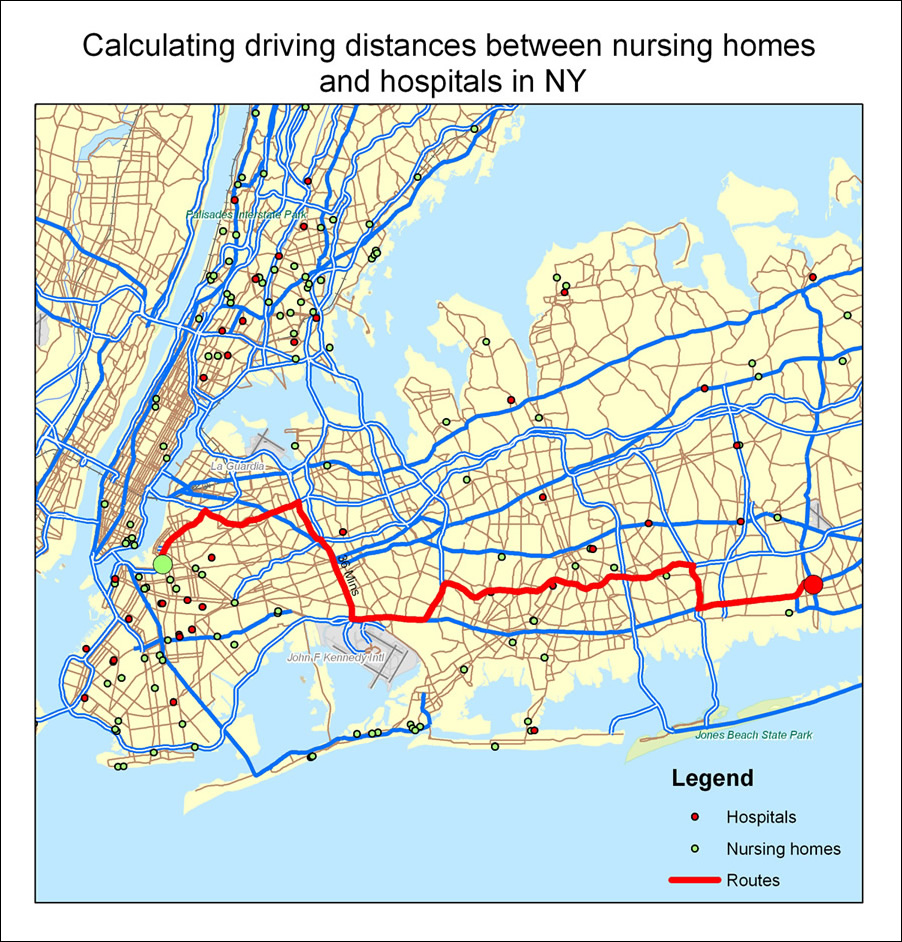 The Center for Geographic Analysis at Harvard University used Esri's ArcGIS Network Analyst and Streetmap USA product to calculate the driving distances between pairs of nursing homes and hospitals in New York state. |
The center's challenge is to assist scholars and students in different disciplines. The following are some of the projects staff have worked or are currently working on.
- Spatially Enabling Social Science Datasets
The Harvard-MIT Data Center (HMDC) has a vast collection of quantitative social science data containing untapped spatial content. The challenge is to spatially enable these quantitative datasets so that they can be searched, analyzed, and displayed geographically.
CGA researchers are studying the methods to identify spatial components in the datasets; extract spatial components and generate spatial features, register the datasets' content to spatial features (that are either internally generated or externally linked), expose spatial components so that they can be accessed through spatial searches, and assess the reliability of the outcome.
One pilot dataset is the Record of American Democracy (ROAD), collected by Harvard's Government Department (visit http://data.fas.harvard.edu/ROAD/). It includes election returns, socioeconomic summaries, and demographic measures of the American public at unusually low levels of geographic aggregation. A geographic unit called the Minor Civil Division (MCD)-Group was created to permit analysis of precinct-level election data with census data. The center's staff developed a tool that allows users to select a subset from the roughly 3,500 electoral and census variables in the ROAD dataset and append them to a shapefile of MCD-Group boundaries. The resulting shapefiles allow researchers to analyze spatial patterns and correlates of voting behavior. Maps could then be made that relate U.S. Census data to election returns at the precinct level, giving scholars and other researchers a better picture of how people voted based on factors such as income, occupation, and ethnicity. They can then study voting patterns based on demographics and geography.
Studying Population Data for the China Historical GIS Project - Studying the Hospitalization of Nursing Home Residents
The hospitalization of nursing home residents is quite prevalent: More than 15 percent of long-stay nursing home residents were hospitalized within any given six-month period. A significant number of these hospitalizations are for conditions such as respiratory infection, urinary tract infection, and congestive heart failure, which could potentially be prevented or treated in the nursing home. Moreover, hospitalizations put nursing home residents at risk for iatrogenic disease and delirium. As a result, potentially avoidable hospitalizations have been targeted as an indicator of poor nursing home quality and an area for improvement. This study by the Department of Health Care Policy at Harvard Medical School examines the predictors and implications of hospitalizations to nursing homes in New York state.
Although a variety of variables may be associated with nursing home residents being hospitalized, one that will be analyzed is the geographic distance between nursing homes and hospitals. This project uses Esri's ArcGIS Network Analyst and free data from ArcGIS Desktop's StreetMap USA to calculate the driving distances between nursing homes and hospitals. These distances will be analyzed, along with data from the centers of Medicaid and Medicare services and New York state, to determine if there is an association between these distances and hospitalization of nursing home residents.
Studying Populations Inside and Outside Conservation Areas
Chinese population data goes back 2,000 years. But it has been difficult to ascertain which geographical areas were the most densely populated because the figures are given as prefectural level aggregates (i.e., the numbers for three to seven counties may be lumped together).
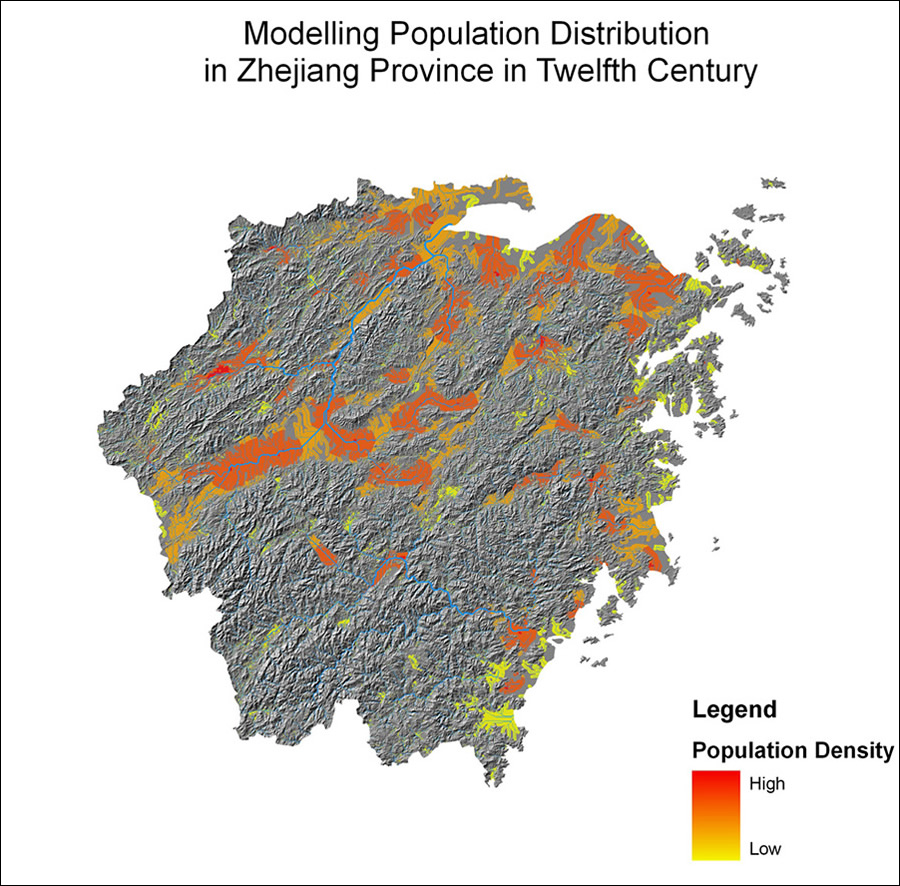 Staff at the Center for Geographic Analysis at Harvard University created this map that showed, hypothetically, the areas of high and low population density in Zhejiang province, China, in 1102. |
To accomplish this, the center's staff created a model and an automated computer program for combining political and physical geography. Knowing, for example, where uninhabitable mountains or desirable land near rivers were located, was important. Using Shuttle Radar Topography Mission (SRTM) data, the computer program generated slopes and stream flows, which, when combined with the locations of administrative seats from the China Historical GIS project and historical population data, provides a means of distributing population. Testing with far more detailed contemporary data has shown that the model can predict settlement patterns with a very high degree of accuracy.
Much in history is directly tied to the spatial distribution of population; GIS gives us a means to understand that history.
In response to concerns about deforestation and habitat loss, many countries have set aside large tracts of land for special conservation status. However, in many instances, such lands are home to settlements of people, agriculture, or timber production.
Clearly, environmental policies have the potential to change patterns of land use, employment, and economic growth. People living in protected areas, for example, must follow regulations meant to protect the land. However, little is known about the actual direction and magnitude of the economic effects of protected area policies on existing or nearby communities, particularly in developing countries. In particular, do protected area policies significantly change the pace of economic growth for better or worse for people in or near these areas compared to similar settlements that do not have protected status? If so, what is the magnitude of the difference, and what are the mechanisms that seem to dominate in explaining the effects?
One project by a researcher in the Economics Department at Harvard analyzed how protected area policies have affected economic development in villages in the Chiang Mai Province in Northern Thailand. The researcher compared the growth of selected household assets and employment rates for villages inside and outside different types of designated forest protection areas from 1986-2003 using biannual survey data from the Thai Community Development Department. Geospatial analysis played an important role as the researcher sought to choose villages in the comparison or "control" group that were similar in terms of geographic characteristics (including elevation, slope, soil type, transportation routes, and proximity to major water bodies) to those villages that were inside protected areas.
What the Future Holds
Within the first half year of operation, CGA has already begun working with faculty across the university on research projects, supporting courses on GIS and introducing GIS to a variety of courses. We look forward to participating in Harvard's new general education program with courses devoted to exploring the cross-disciplinary application of spatial analysis and training undergraduates to participate in research using GIS. Spatial analysis needs to be part of the intellectual toolkit of the kinds of future leaders Harvard recruits. We have also begun to consider how we can participate in executive education programs that will give current leaders in government and business opportunities to see the value of GIS applications in their own fields. But these tasks are not, and should not be, unique to this university.
Already one of Harvard University's closest peers has taken note and announced the founding of its own GIS center!
For more information about Harvard University's Center for Geographic Analysis, visit the center's Web site at www.gis.harvard.edu.