Canadian Television Network Taps Esri Canada Limited to Find Patterns in Parking Citation Data
By Matthew DeMeritt, Esri Writer
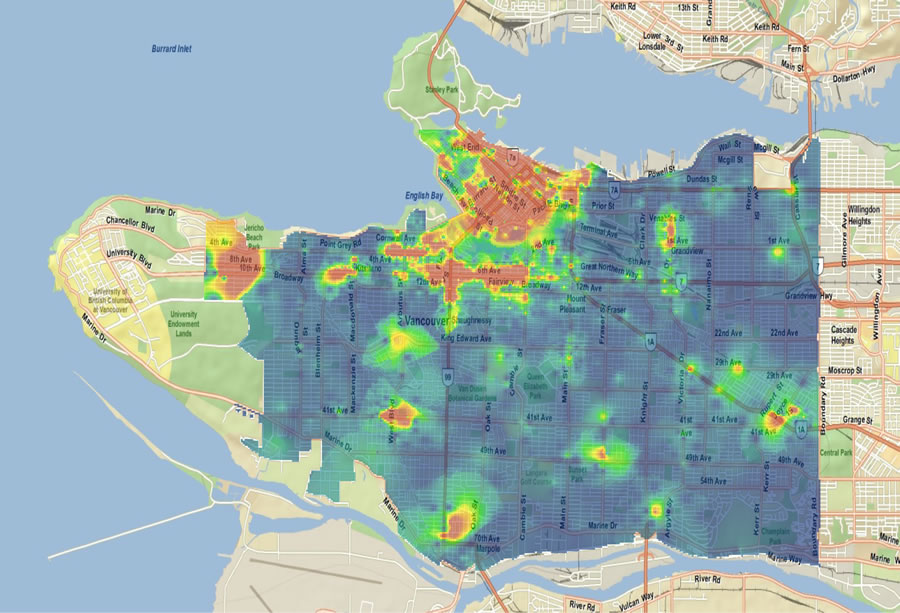 Created by Esri Canada Limited using ArcGIS Online and ArcGIS Server, this map shows hot spots of parking enforcement in Vancouver. Red, orange, and yellow display concentrations of citation and towing activity, while blue shows almost no enforcement. |
It's one of the signs heralding a bad day: a loathsome parking ticket slapped on the windshield of your car. If the fates are really against you, you'll end up taking a taxi trip to reclaim your pride and joy from the impound yard.
In downtown Vancouver, British Columbia, Canada, this happens regularly to people just trying to squeeze in some shopping in the late afternoon. Canadian television network CTV recently used GIS to help investigate the distribution of parking enforcement in the bustling Canadian metropolis in a series titled "Know Parking Here." The first part of the series used GIS to analyze citation data from Vancouver's popular residential and retail districts. Read the CTV story.
Each year, the City of Vancouver issues approximately 400,000 parking tickets to motorists. With such a large number, CTV producers were curious about when and where the dreaded yellow slips were being handed out. Canada's Freedom of Information and Protection of Privacy Act allowed CTV to obtain two weeks' worth of parking ticket information from the city of Vancouver. That amounted to 16,000 citations issued by the city-too much data to scrutinize manually. That's when someone at CTV had a brain wave.
"Our producer remembered we had previously talked to [someone at] Esri about using GIS for stories," says Jon Woodward, reporter, CTV. "He remembered that they took data from a simple spreadsheet and created informative maps. [Esri was] the obvious choice to make sense of this huge document."
Not only was GIS analysis and mapping just what CTV was looking for-a dynamic visual representation of parking enforcement data-it also spared CTV staff the intimidating task of sorting through the ticket information to find the patterns.
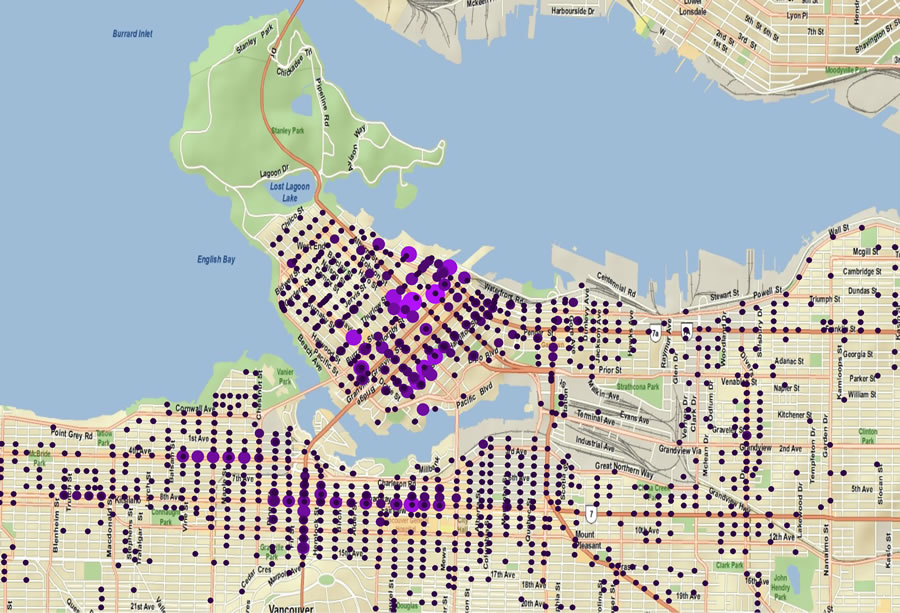 This is the zoomed-in view of an interactive map. Purple rings are larger where more tickets were issued. |
The map that GIS analysts at Esri Canada Limited created revealed something surprising. It showed hot spots of enforcement around high retail areas where parking meters were located, while surrounding areas where parking signage was posted but meters were not as prevalent showed almost no parking enforcement.
"That was the surprise," says Woodward. "The map revealed that residential areas and zones without meters are places you can pretty much leave your car all day without risking a ticket. The map does not lie."
The map posted on the CTV Web site shows the high-risk locations for receiving a parking ticket in red and the low-risk areas in blue. Readers can zoom in and see, street by street or neighborhood by neighborhood, where parking enforcement was strict and lax.
Hotly patrolled areas in commercial zones virtually guaranteed a ticket if the signage wasn't diligently obeyed. The intersection of Robson and Burrard streets showed the highest concentration of enforcement, hardly a surprise given its location at the heart of the city's retail district.
Most importantly, the map showed that the number of tickets issued and vehicles towed dramatically increased as rush hour approached. "Parking enforcement increased late in the afternoon for a reason," says Woodward. "The pressure is on meter enforcers to get the parking lane clear for traffic before rush hour starts at 4:00 p.m."
To extract the patterns from the spreadsheet, Esri used the Crime Analyst extension in ArcGIS. With that tool, Esri created an aoristic clock (a method of allocating proportions of events to time intervals on a 24-hour clock). The clock graphically displays the number of tickets that parking enforcement officers issued as well as the time at which they were issued. The tool was instrumental in creating the interactive map for CTV's Web site.
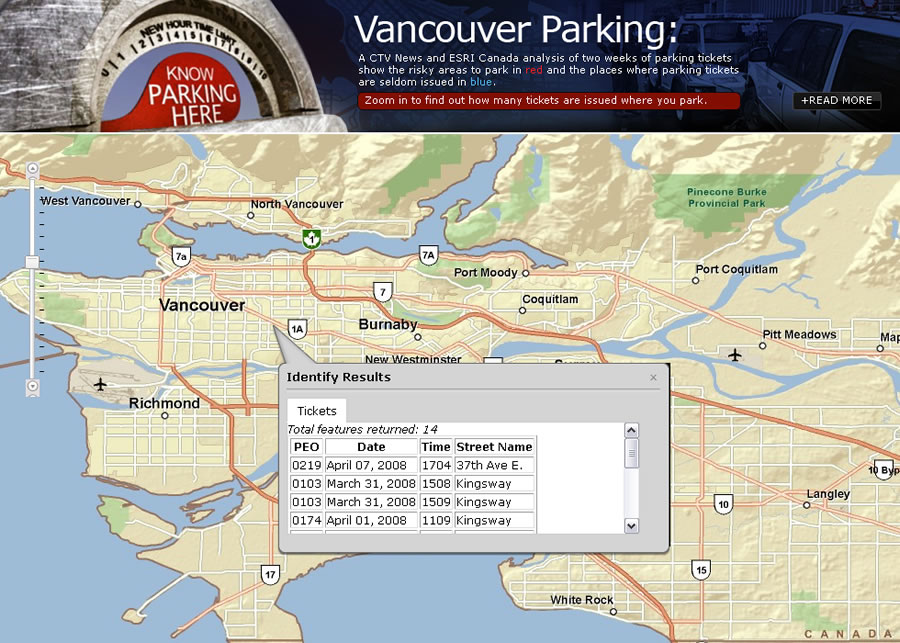 A results window pops up to display all parking violations in a given area. |
"We used the world street map layer from ArcGIS Online for the background," says Julie Scott-Ashe, GIS consultant at Esri Canada. "After CTV pulled information for the story, we served the map for their viewers using ArcGIS Server and the JavaScript API. JavaScript wraps the map in a user-friendly application."
The interactive map allows site visitors to scroll around and zoom in to Vancouver's retail and residential districts to see the distribution of enforcement. Users can click points on the map, calling up date, time, and location of each parking ticket and towing incident throughout the downtown district.
The analysis was particularly important because it showed the logic of parking enforcement in Vancouver. Interviews of motorists who received parking tickets in CTV's report indicated that their annoyance stems from what they see as a lack of leniency in parking enforcement. The investigation, however, revealed that enforcement was extremely lenient up to the point when weary commuters took precedence over weary shoppers.
"At some point, shoppers must drive home in the same traffic tow truck operators had the courtesy to clear for them," Woodward says with a laugh. "The map was instrumental in showing this."
To view the map, visit www.ctvbc.ctv.ca/knowparking.