ArcWatch: Your e-Magazine for GIS News, Views, and Insights
December 2011
Tips for Using the Light Gray Canvas Basemap
Your map's message will be easy to see and understand on Esri's new Light Gray Canvas basemap, available free from ArcGIS Online. The neutral background puts your thematic information center stage. The four tips below will help you use the basemap effectively.
The Light Gray Canvas basemap provides a neutral background for operational overlays and is particularly useful when you do not want or need a topographic map background. It contains less detail and a narrow range of colors, which increases the space and palette available for operational overlays. In thematic mapping, neutral backgrounds are most often used when you only need to show basic geographic features like administrative boundaries. Map readers can then relate the patterns they see to features and names they are familiar with.
To add the Light Gray Canvas basemap to an ArcMap session, click Add Data > Add Basemap and then select the Light Gray Canvas basemap (figure 1).
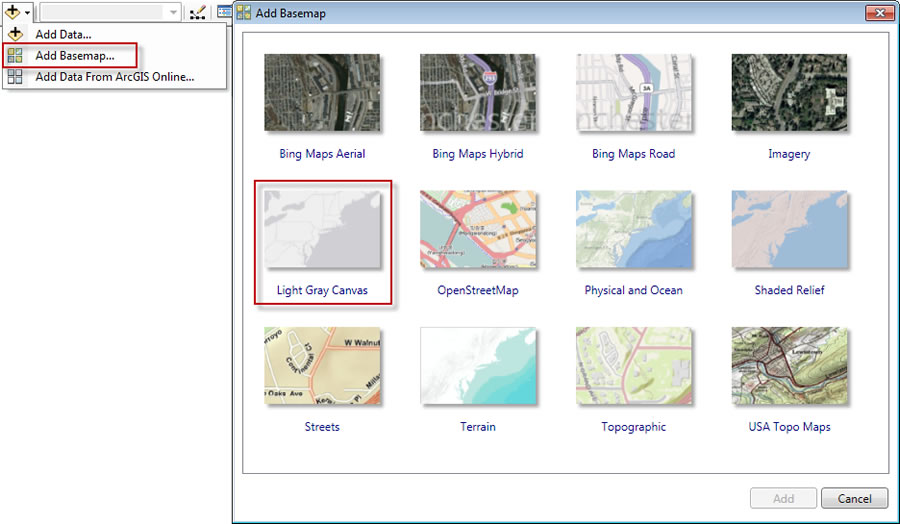
Figure 1. Add the Light Gray Canvas basemap to an ArcMap session by using the Add Data button.
Tip One: Using the Individual Components of the Light Gray Canvas Basemap
You'll notice that the Light Gray Canvas basemap is added as a new basemap layer with two components-Reference and Base (figure 2). To place labels on top of your other map detail, you can separate the Base and Reference components of the Light Gray Canvas basemap in ArcMap, ArcGIS.com, or ArcGIS Explorer Online.

Figure 2. Add the Light Gray Canvas basemap to ArcMap as a base layer.
The Reference layer contains city labels, and the Base layer contains the basemap itself. Operational layers, when added, will be drawn on top of both layers. Ideally, however, you want the Reference layer to be drawn over the operational layers. Remedy this by clicking and dragging the Reference item to a position higher up in the table of contents (figure 3).
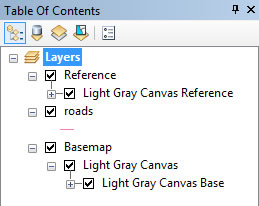
Figure 3. Move the Reference service out of the Base layer.
Figure 4 illustrates the Reference layer when drawn over the operational layer.
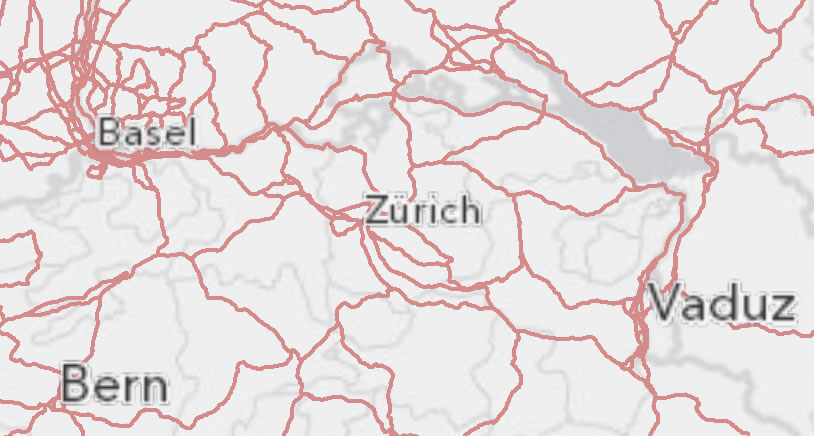
Figure 4. City Labels Positioned above the Operational Overlay (shown in red)
The same principle applies when you use the Light Gray Canvas basemap to create a web map using the arcgis.com map viewer or ArcGIS Explorer Online. Instead of adding the basemap from the Basemap Gallery, add basemap layers by using the Add button and the Search for Layers option. If you search for "canvas map" in ArcGIS Online, you get two results: World Light Gray Reference and World Light Gray Base (figure 5). Once these are added as separate layers, you can position your operational overlays above the Base layer and below the Reference layer so that the labels appear on top.
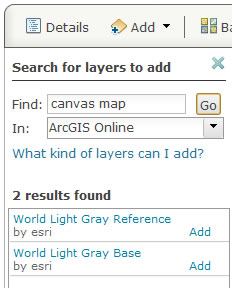
Figure 5. Add the Light Gray Canvas basemap Reference and Base layers in ArcGIS.com.
Tip Two: Building Graphical Structure into Your Map
The colors you select for your operational overlays can alter how the overlays appear in relation to the basemap; you can either bring the overlays to the foreground or push them to the background, depending on the message of your map. Color has three components: Hue refers to the dominant wavelength of light (e.g., red or blue). Saturation refers to the intensity of the color. Saturated colors are vivid, while desaturated colors tend toward gray tones. Value refers to brightness-light through dark. As a result, you can select a color (e.g., blue) and then alter its saturation and value to modify it. Changing saturation allows you to make intelligent design choices for the operational overlays used on the Light Gray Canvas basemap.
By using low-intensity colors (i.e., colors low in saturation) that complement the gray tones in the basemap, you can effectively create the appearance of additional basemap content. For example, in figure 6, county boundaries have been added to provide a richer basemap content. Ireland's counties are now more legible but do not appear more prominent than the other basemap detail.
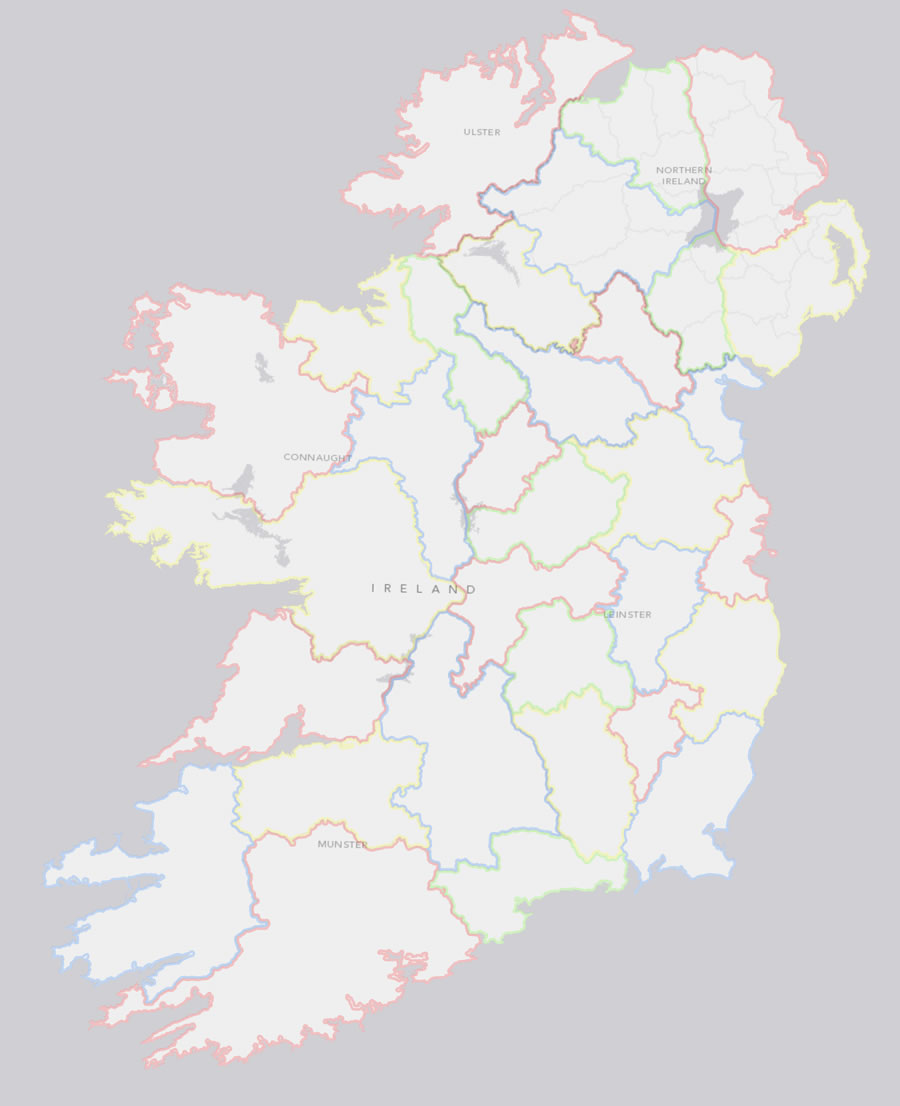
Figure 6. Low-intensity colors can be used to add basemap content.
On the other hand, if you really want your operational overlay detail to pop and contrast with the basemap, use colors that have higher saturation (figure 7).

Figure 7. High-saturation colors make operational overlays 'pop'.
A new set of styles can be downloaded from the ArcGIS > Styles page on the Esri web site to help you make appropriate color choices for operational overlays when using the Light Gray Canvas basemap. LightGrayCanvas_Bold colors are high in saturation, LightGrayCanvas_Light colors are low in saturation, and LightGrayCanvas_Medium colors are in the middle.
Tip Three: Using Continuous Polygon Operational Overlays in ArcGIS.com
This tip explains how to effectively use continuous polygon data with basemaps.
The Light Gray Canvas basemap works particularly well for point and line data and discontinuous polygon data. All web maps suffer, to a greater or lesser degree, from problems when you add continuous polygon data as an operational overlay, because the polygons function as a basemap in their own right.
One approach is to add the Light Gray Canvas basemap Base and Reference layers over your polygon data. Applying transparency to the Light Gray Canvas basemap Base layer will allow you to see some of the basemap detail on top of your polygon data (figure 8), though it does have the effect of reducing the intensity of your underlying polygon symbology.
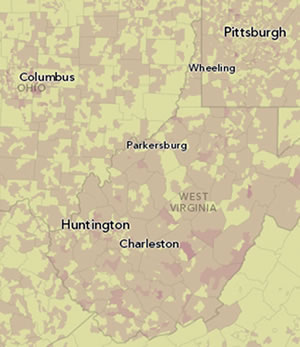
Figure 8. Add the Light Gray Canvas basemap with 50 percent transparency and position the reference layers on top of your continuous polygon data. This allows some base detail to be seen.
Alternatively, if you place your operational overlay on top of the basemap, thus obscuring it, you can supply additional geographic context with further operational overlays. Figure 9 illustrates this idea. The operational layer, which shows natural habitats of the Indo-Malayan realm, is combined with additional operational overlays that have boundaries and labels.
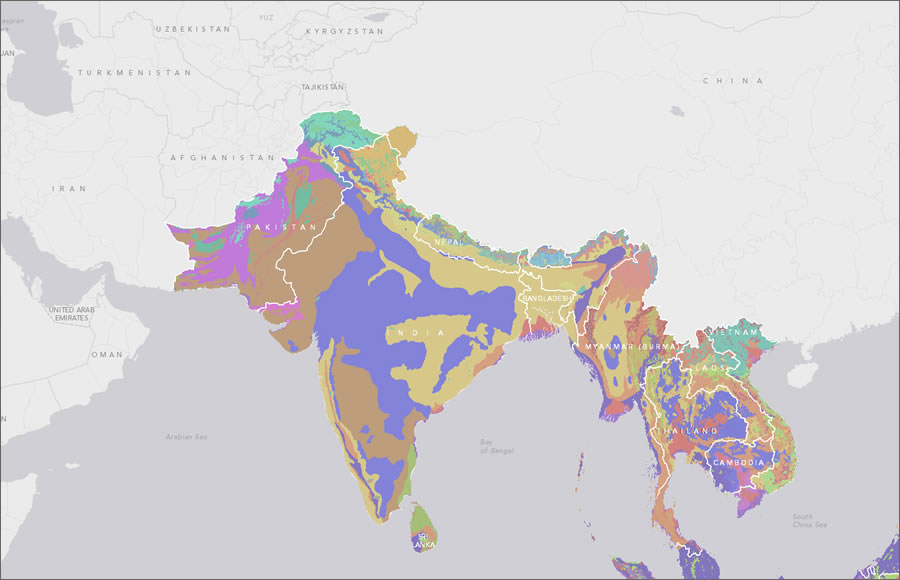
Figure 9. Add operational overlays to help replace geographic content that becomes obscured when continuous polygons are drawn over the basemap.
Tip Four: Using Transparent Basemaps
Finally, basemaps used in ArcGIS.com don't actually have to be shown. When you make a new map in ArcGIS Online, the default web map contains a preloaded basemap. Once you have added your own continuous polygon data, plus any other data you require, set the transparency of the basemap to 100 percent. Although the basemap remains in the list of layers in your web map, it will not be visible. Figure 10, a web map version of an Irish surnames map, illustrates this effect.
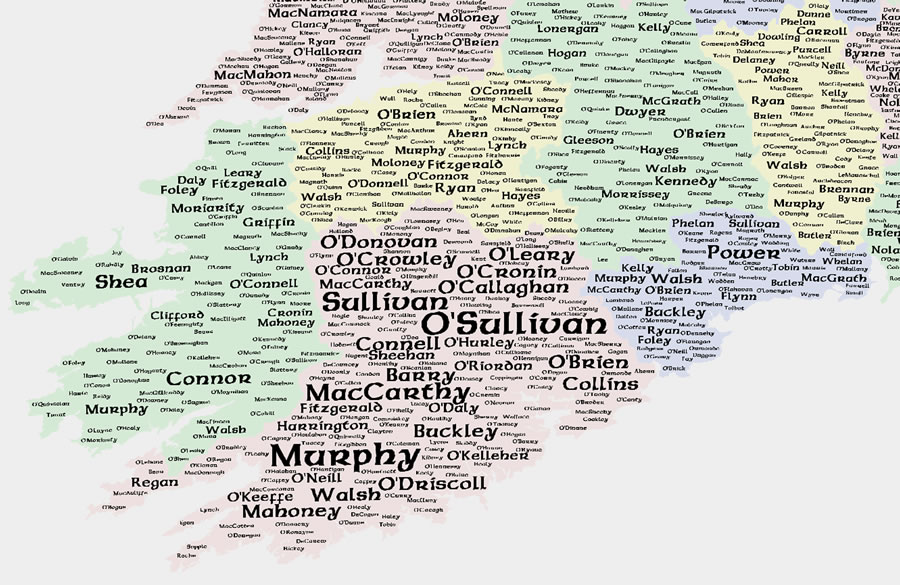
Figure 10. Using a transparent basemap layer allows your continuous polygon layers to take center stage.
Now you know how you can use the Light Gray Canvas basemap in some inventive ways, giving you more control over how your maps appear in ArcMap and on ArcGIS.com. You can find more tips for using the basemap at the Esri Mapping Center blog and in the ArcGIS Online blog.