Fall 2003
Fall 2003 |
|||||||
|
|
|||||||
Analyzing the Consequences of Chernobyl Using GIS and Spatial Statistics |
|||||||||||
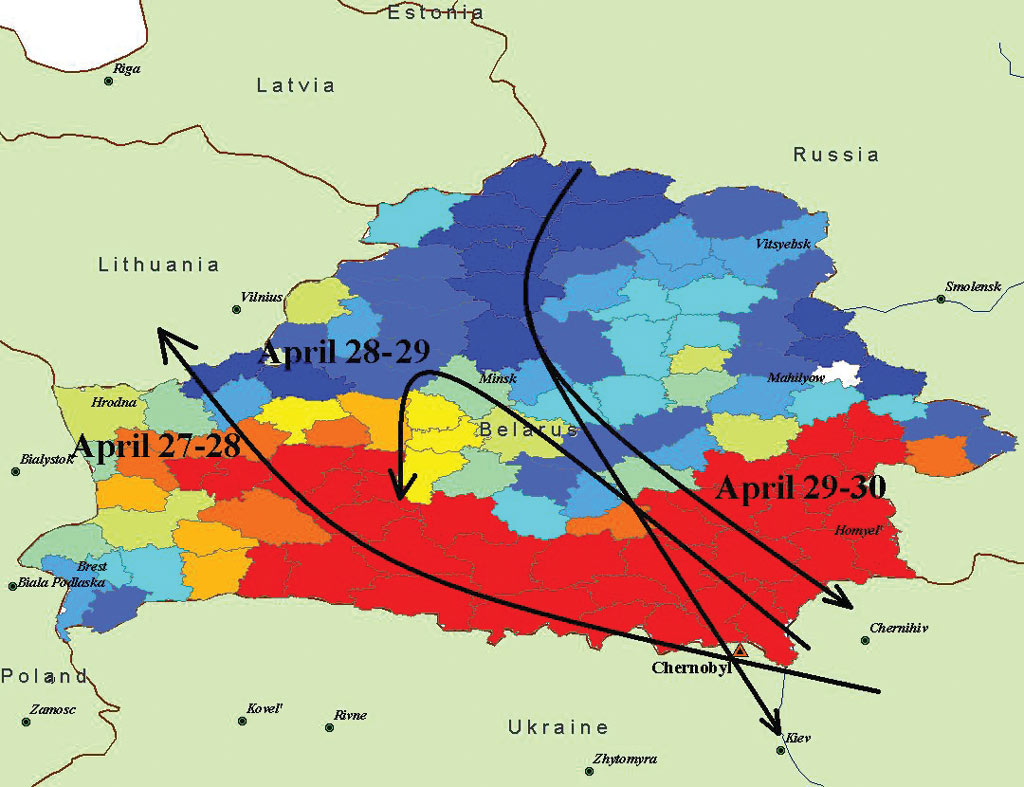
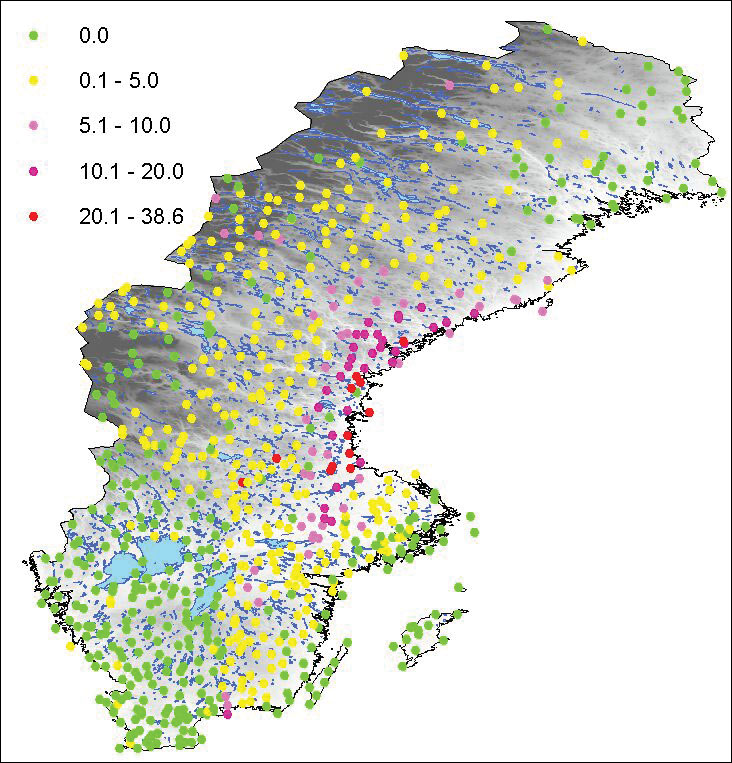
On April 26, 1986, at 1:23 a.m., a chain reaction occurred in the Chernobyl nuclear reactor, creating explosions that blew off the reactor's heavy steel and concrete lid. From Chernobyl in the former Union of Soviet Socialist Republics (now in Ukraine), radiation spread across Europe in perhaps the most catastrophic industrial event in the planet's history. Radioactive particles remained suspended in the atmosphere for many days and were distributed as far as Scandinavia, the United Kingdom, and Greece. Because of the long half-life of radiocesium (about 30 years), the main radioactive atom (or radionuclide), deposited across Europe, agricultural effects have continued to last many years after immediate health effects ceased. For this reason, it is important to assess the eventual health effects of radiocesium consumed through contaminated food. GIS and spatial statistics have provided valuable tools in the analysis of the long-term effects of radioactive exposure to affected populations. Consequences of Radioactive Exposure on Human HealthThe release of radionuclides into the surrounding environment showed little hint of disaster as the contamination was invisible. However, when released into the atmosphere, each radioactive particle has a probability of forcing changes in both DNA and the immune system, changes that in turn have a detrimental effect on the individual's ability to cope with even low levels of radiation. Radioactive fallout from the atmosphere is stored within soils, from here transferring into vegetation and up through the food chain, and ultimately increasing the likelihood of cancer. In the case of environmental chemical pollution, risk of serious diseases may increase significantly. As detailed below, ArcGIS and the ArcGIS Geostatistical Analyst extension were used to perform detailed analysis of radiation contamination and its links to health. Radioactive Rain in SwedenDetailed meteorological data is very important in the early hours following accidents that produce large amounts of chemical or radioactive emission. Even before measurements of radionuclide contamination are collected on the ground, rainfall data can be used to identify territories where immediate countermeasures should be taken. In 1986, Sweden's meteorological network consisted of more than 700 meteorological monitoring stations. Taking into account wind direction and the distance from Chernobyl to the Swedish border, one could assume that the rain a few days after the accident was radioactive.
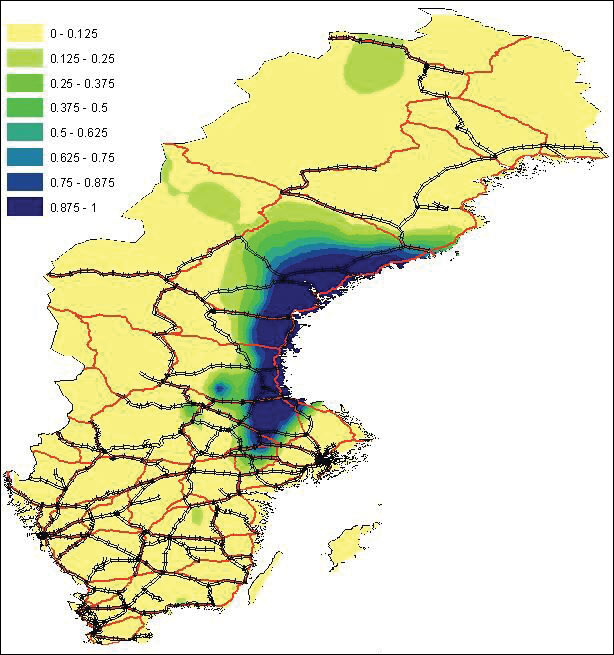
In general, no matter how dense the monitoring network, there are many areas where observations are not available, and predictions of unsampled locations are required to identify affected territories. However, another important aspect comes into play while predicting the data: each prediction is associated with prediction uncertainty, and this uncertainty can be crucial for decision making. One possible way to combine predictions and prediction uncertainties is to create a map of the probability that a certain threshold rainfall value was exceeded. A geostatistical model of spatial data uses the semivariogram, a function of the distance and direction separating two locations, to quantify the spatial correlation in the data. The semivariogram is then used to define the weights in the kriging system that determine the contribution of each data point to the prediction of new values. Kriging refers to geostatistical interpolation techniques that use the statistical properties of observations. These geostatistical techniques quantify the spatial autocorrelation among measured points and account for the spatial configuration of sample points around the prediction location. Kriging has a measure of prediction uncertainty, allowing the determination of the degree of prediction accuracy. The ArcGIS Geostatistical Analyst extension employs several models for probability mapping, each based on different assumptions. Using these models, the author (see contact information below) demonstrated that rain on April 29 was the cause of radiocesium soil contamination in the central and eastern parts of Sweden. Contamination of other Swedish areas was caused by rainfall in the following several days. It is obvious that the rain was the only possible reason for the radioactive fallout, and good meteorological data would allow authorities to take countermeasures immediately, without waiting for actual data on soil and air contamination with radionuclides. Thyroid Cancer Rates in Belarussian Children
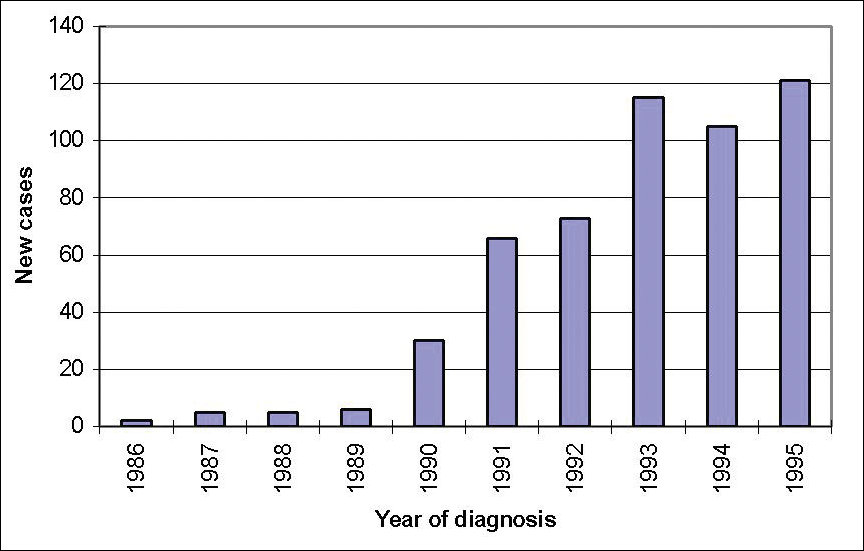
During the first days after the accident, residents of Belarus absorbed large radiation doses through their thyroid glands via inhalation of contaminated air and through consumption of contaminated food, mostly cow's milk and fresh vegetables. The population was not informed about the nuclear accident and the necessity of iodine prophylaxis. (Iodine prophylaxis is very effective and simple: individuals swallow a stable iodine pill and iodine occupies the thyroid gland, thus preventing radioactive iodine absorption.) Prior to the Chernobyl accident there was approximately one case of thyroid cancer per year per the entire Belarus child population. As a result of irradiation by short-lived radionuclides, including radioactive iodine, there has been a steady increase in the number of new cases over time. The spatial distribution of the cumulative incidence rate over 10 years (1986-95) reached as many as 1.72 cases per 1,000 children in Bragin, 1.68 in Narovlya, and 1.28 in Hoiniki districts. These districts are the closest to Chernobyl. Data was provided by the Sakharov Institute of Radioecology, Minsk, Belarus. If data is aggregated over polygonal regions as in the case of thyroid cancer, a geostatistical approach will limit proximity measures to the distance between the centroids of the polygons. Distance between locations should be based on meteorological data and not just on straight-line distance. Also, cancer rates violate the assumption of stationarity that is fundamental to the definition of the semivariogram. Stationarity is a term meaning that statistical properties do not depend on exact locations, so the mean (expected) value of a variable at one location is equal to the mean value at another location. Even more important, variance should be constant in the area under investigation, and the covariance between any two locations depends only on the vector that separates them, not on their exact locations.
The assumption of stationarity provides statistical replication in a spatial setting. When this stationarity assumption is violated, maps constructed from kriging that rely on such a biased semivariogram may be misleading. The author used filtered kriging (i.e., prediction of new value to the data location, assuming that data is contaminated by measurement error), and this map should be used just as qualitative information because of difficulties with the geostatistical approach using aggregated data. Models and tools for aggregated data are our special interest for the development of the next version of the ArcGIS Geostatistical Analyst extension. The ArcGIS Geostatistical Analyst extension allows analysts to perform these analyses within the ArcGIS environment and create a map that is both accurate and visually accessible for a range of viewers from educators to decision makers. Since thyroid cancer is primarily caused by irradiation by short-lived radionuclides, a continuous map of thyroid cancer risk can help in the identification of population irradiation by short-lived radionuclides, which are distributed according to the meteorological conditions of the very first days after an accident. Such a map can provide useful information on the cause of other chronic diseases that can arise as the result of irradiation as well as from other environmental and sociological factors. Radiocesium Food Contamination in BelarusToday, internal exposure from food contaminated by radiocesium contributes to more than half of the whole radiation dose received by Belarussian people. Income of the inhabitants of villages in southern Belarus does not afford them access to noncontaminated food. They consume vegetables, potatoes, and milk produced on their own, often contaminated, personal properties. This diet is often supplemented with mushrooms and berries from nearby forests.
More than 50,000 measurements of radiocesium in the main types of food were collected by the Byelorussian Institute of Radiation Safety in 1993. The cases of radiocesium exceeding the upper permissible level in food were published in the institute's information bulletins, which may potentially help families under high radiation risk. As radiocesium contamination is distributed very nonuniformly both geographically and within different types of food, probabilistic mapping is especially valuable in understanding and informing at-risk populations. The ArcGIS Geostatistical Analyst extension allowed the author to use repeated observations, supplementary information, and estimated measurement error to filter out this error when predicting relative to the data location. This allowed the identification of the most at-risk regions, areas where contamination of each of the staple foods is high. For more information, contact Konstantin Krivoruchko, software development lead, geostatistics, Esri (e-mail: kkrivoruchko@esri.com). |