Fall 2005
Fall 2005 |
|||||||
|
|
|||||||
GIS Volunteers Help in Mississippi's Hurricanes Katrina and Rita Response |
|||||
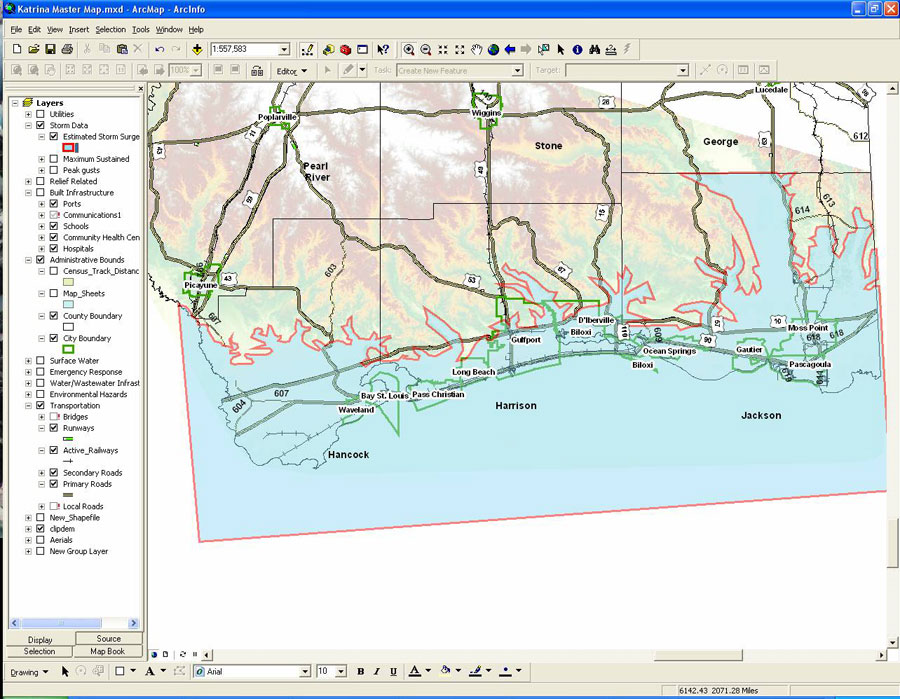
Response efforts to Hurricane Katrina have come in many forms from a wide range of people and organizations, both public and private. In Mississippi, GIS volunteers, many from the Urban and Regional Information Systems Association (URISA) GISCorps, were among the first on the ground helping wherever needed. "Our first project was in response to the 2004 tsunami disaster," says Shoreh Elhami, GISCorps cofounder and chairperson. "With each new project, more and more volunteers are coming on board and doing tremendous work. I think the response to Katrina is another example of this type of overwhelming response by the GIS community. It makes me feel so proud of the profession that we are in." On August 30, following Hurricane Katrina's massive devastation of the Gulf Coast, Talbot Brooks, a professor and GIS practitioner as well as director of the Center for Interdisciplinary Geospatial Technologies at Delta State University in Cleveland, Mississippi, who had been providing GIS services in Mississippi prior to the hurricane touching land, contacted GISCorps' Elhami through Esri to ask for GIS assistance. In response to this inquiry, URISA widely distributed a call for volunteers to assist with recovery efforts. The response was overwhelming: nearly 3,000 inquiries came in from people volunteering to help. Based on specific requirements from Mississippi, two GIS teams consisting of 20 people were then deployed, with more than 32 volunteers eventually deployed in Mississippi. Their work, especially in the initial aftermath of Katrina, was paramount in emergency response efforts. "It was a true team effort," says Brooks. "GISCorps, GITA, Esri, Leica Geosystems, and volunteers from Mississippi agencies and the state education system all played significant roles in the response and rescue efforts using GIS technologies. Maps and analyses were prepared by all these agencies. All data represented draws from the pooled resources of Mississippi Emergency Management Agency, Mississippi Automated Resource Information System, Esri, and other responding agencies." Assembling the Initial GIS Volunteer TeamBrooks, along with several students from Delta State University and a handful of other volunteers, was recruited by county staff workers to travel to the Jackson, Mississippi, Emergency Operations Center (EOC) to help where they could. Upon arriving, Brooks quickly called for support from his colleagues at other Mississippi educational institutions. Among the assets to respond was a mobile classroom that was hastily converted into the "brain bus" to provide maps and GIS analysis. The GIS used at EOC prior to Hurricane Katrina landing was the Federal Emergency Management Agency (FEMA) HAZUS model that runs within ArcView software's ArcMap application. HAZUS was used for predictive modeling for wind damage within the storm's track. Brooks immediately set to work expanding the role of GIS, using digital elevation models within ArcGIS 3D Analyst software's ArcScene application to model storm surge flooding and ArcMap to produce street-level maps and search and rescue grids for first responders staging in Jackson. From August 27 to 29, more than 3,000 feet of maps were printed on two plotters in the Jackson Emergency Operations Center. With the storm having swept through the area, staff members were now busy working on postevent operations. The GISCorps was then tapped by Brooks for additional volunteers. The GISCorps Committee worked to identify individuals with the right qualifications to volunteer their time and expertise at the Emergency Operations Center in Jackson. The volunteers in this first deployment were from Arkansas, California, Colorado, Florida, Illinois, Missouri, New York, North Carolina, Ohio, and Texas and have an average work experience of eight years. Within the first day alone, a 24/7 GIS infrastructure with 60 volunteers was in place. In addition, aerial photography and other data sources were pooled together for mapmaking.
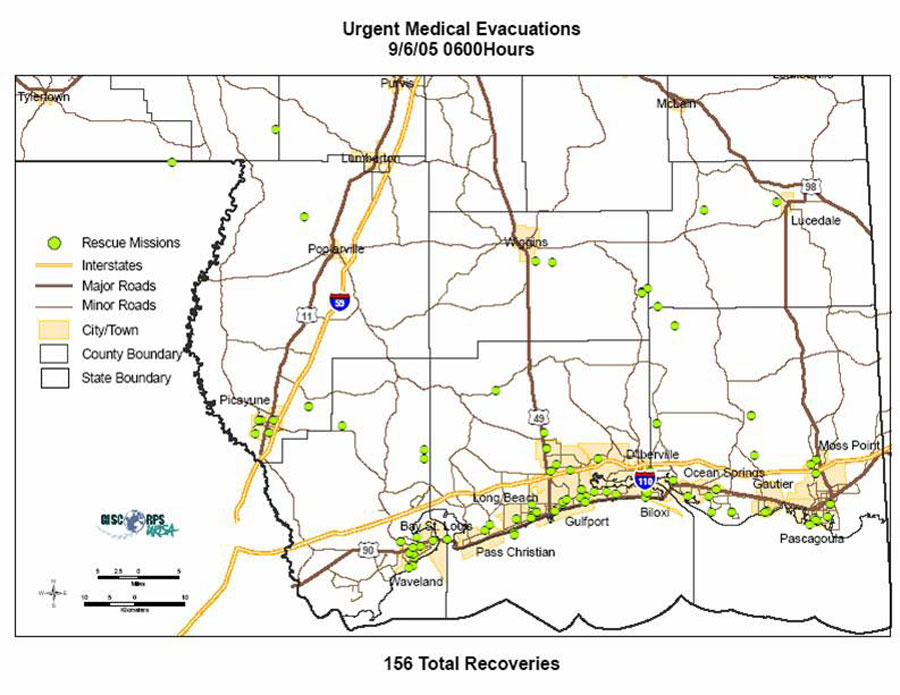
"Our Geospatial Information and Technology Association (GITA) membership wanted to help, so when we were asked, we immediately engaged our members," says Bob Samborski, executive director, GITA. "These individuals, along with other resources, worked tirelessly to create thousands of maps. The team also processed and analyzed aerial imagery as it became available as a means of targeting relief efforts. These were used for the many support staff members who were streaming into the area from other regions of North America." GIS Maps for Incident Centers and First RespondersThe maps produced by GIS volunteers typically fell into two categories. The first category of maps showed "the big picture" and provided overall situational awareness for incident commanders and other high-level decision makers at county EOCs and the Mississippi Emergency Management Agency, as well as the governor and even the president of the United States. The second category of maps was customized for use by first responders and emergency staff on the ground in harm's way. Situational awareness maps included locations of regular production of power outage/restoration; cell phone coverage as towers came back online; areas of potential flooding; road closures and access; aid and comfort facilities, such as shelters and kitchens; water and ice distribution points; command and control areas for the National Guard; environmentally hazardous sites; public infrastructure, such as electric substations; and medical care facilities, as well as FEMA declarations for aid eligibility. First responders on the ground needed street maps: search and rescue maps consisting of street maps with population density, a gridded overlay, and a graticule showing latitude/longitude and maps with the locations of specific features of interest based on responder requests. ArcGIS Desktop was used as the primary tool to edit and produce maps. ArcSDE served as the data management/database tool in Redlands, California, and eventually in Jackson. ArcIMS was used to help disseminate information among EOC personnel, and ArcGIS 3D Analyst was used in flood modeling. GIS Helps with Rescues, Missing Persons, Other First Response UsesGIS played a significant role immediately following the devastation wrought by Hurricane Katrina, including with search and rescue operations. U.S. Coast Guard helicopters used GPS coordinates provided by volunteer staff to evacuate people from flooded homes. With streets flooded and addresses unavailable from boat or helicopter, phone calls from people requesting evacuations were taken, and addresses and other landmarks were converted into coordinates that rescue staff could use to locate the individuals. GIS volunteers translated hundreds of addresses/locations into GPS coordinates for the U.S. Coast Guard rescue helicopter evacuation missions. "We were able to help people in helicopters find evacuees calling in for rescue," says Brooks. "People were calling in with a street address, but streets were flooded and there was no way to locate addresses on flooded homes from a boat or helicopter. So we helped transform addresses to latitudes and longitudes using GIS." A missing persons Web site report and database developed through on-site volunteers; University of California, Berkeley; and Digital Quest assisted with filing thousands of missing persons reports. These reports were used to build a missing persons feature class known as Last Known Location and aided in searches to map and direct emergency response. Nearly 200 initial search maps were generated in less than 10 hours, then laminated by ASAP Printing in Jackson. A revised and expanded collection of search maps for eight county areas was then developed to be used for house-to-house searches. Briefing maps were also used for daily planning sessions and other communications to visually depict things, such as power outages, locations of trees and road closures, communication networks, and aid stations. Additional mapping support services include the location of critical infrastructure, such as water wellheads, water treatment plants, and other facilities that cannot be easily located because of flooding and debris. "There were a number of ways GIS maps and mapmakers made a difference in the Hurricane Katrina response," says Elhami. "We continue to have GISCorps volunteers helping there now. We'll do everything we can to help; learn from this event; and, hopefully, be even more prepared for future events." Response to RitaDuring Hurricane Rita, the EOC played a more local role as the area was affected by severe flooding and tornadoes. The Center for Interdisciplinary Geospatial Information Technologies used a combination of ArcGIS products and weather radar to track tornadoes for the Bolivar County Emergency Operations Center, create storm damage maps, and help route emergency responders during tornado outbreaks. With the help of GIS, local responders were often on scene within minutes of a tornado strike, and GIS made a big difference. For more information, contact Talbot Brooks, director, Center for Interdisciplinary Geospatial Information Technologies, Delta State University (tel.: 662-846-4520, e-mail: tbrooks@deltastate.edu). |