Fall 2005
Fall 2005 |
|||||||
|
|
|||||||
International Efforts Support Equatorial Pacific Ecoregional Biodiversity Assessment with GIS |
|||||||||
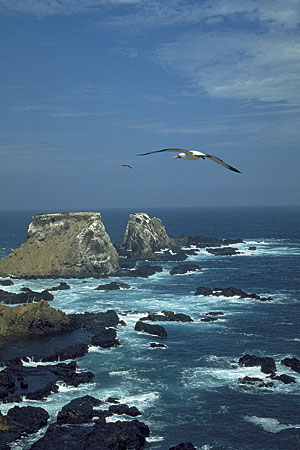
The area identified by The Nature Conservancy (TNC) as the Equatorial Pacific Ecoregion extends along 1,000 kilometers (621 miles) of the Pacific coast in south-central Ecuador and northern Peru and includes one of the world's most biologically dense and diverse marine environments. Covering more than 13 million hectares (32 million acres), it comprises four distinct ecoregions (three terrestrial: Ecuadorian dry forest, Guayaquil flooded grasslands, and Tumbes/Piura dry forest and one marine: Gulf of Guayaquil) with four associated mangrove complexes (Gulf of Guayaquil, Manabi, Piura, and Tumbes). Each ecoregion contains wet zones completely surrounded by dry zones or otherwise environmentally isolated, which creates a virtual mosaic of different ecological systems with high biological diversity and a high incidence of endemic species (unique plants or animals restricted to small geographic areas). The Gulf of Guayaquil marine ecoregion is especially notable because the Humboldt Current upwells nutrient-packed ocean water along the Pacific coast to support a spectacularly rich marine life.
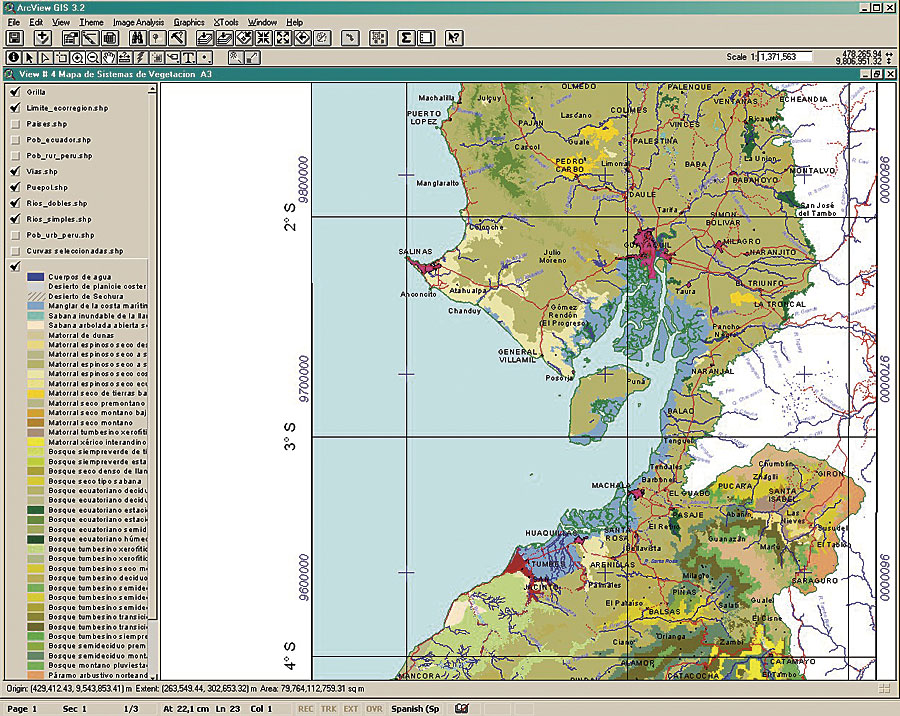
To identify the region's areas of biodiversity importance and develop a conservation plan, TNC participants first needed to prepare a comprehensive basemap of an area the size of the state of Virginia in the United States and spanning the Ecuador-Peru border. They also had to collect relevant ecological information about terrestrial, freshwater, and marine areas. ArcInfo and ArcView were used to link digital maps with data and provide analytic tools for creating, managing, and monitoring the portfolio. International EffortIntegrating efforts in two countries and combining maps and data that had been created using disparate technologies, methods, and standards presented a major challenge. Local conservation organizations helped by coordinating cooperative sharing of their respective government agencies' existing maps and study data. Partners in the data collection and analytical process in Peru included the Conservation Data Center-Peru (CDC-Peru), the Society for the Investigation and Monitoring of Biodiversity in Ecuador, and Nazca—all dedicated to biodiversity studies and species and habitat preservation—as well as Fundaci�n AGUA, which is dedicated to water resources conservation. Jatun Sacha of the Foundation/Conservation Data Center-Ecuador (CDC-Ecuador) and EcoCiencia, which is also dedicated to biodiversity studies and species and habitat preservation, participated in coordinating data collection and analysis in Ecuador. In addition, major museums, botanical gardens, universities, and nongovernmental organizations supported the effort by contributing research data. Basemap PreparationThe first phase of preparing the basemap included collection and revision of basic cartographic and thematic information. CDC-Ecuador was in charge of preparing the maps for the entire Equatorial Pacific Project, while the CDC-Peru team provided cartographic information and participated in validating and revising the results. The Ecuador portion of the basemap was prepared from information compiled in the 2002 Ecuador Digital Almanac, which was originally prepared for agricultural, livestock, and watershed management purposes by CDC-Ecuador, the International Corn and Wheat Center, and the University of Azuay. Technicians updated the maps by verifying transportation network locations and characteristics with field visits, identifying and correcting gaps, and merging the map extents to make one seamless map that included the entire study area. To combine mapping systems used by the two nations, they also defined common references, establishing a 1:250,000 mapping scale and adoption of the UTM Zone 17 south projection and the horizontal datum established for South America in 1956 at La Canoa, Venezuela. They defined an overall symbology convention and map elements, such as the area boundary, 1,000- and 200-meter contour intervals, primary and secondary rivers, roads, political boundaries, and naming conventions.
For the merging of separately designed databases, attribute tables were compared and adjusted to ensure that the database structures corresponded and the same coordinate system was being used. To prepare the vegetation and land-use data, information was gathered from satellite imagery taken in 1998, 1999, and 2000 and from several previous land-use studies for both Ecuador and Peru. Previous studies included nationwide products (such as the Vegetation Map of Peru prepared by Peru's National Institute for Natural Resources), as well as maps prepared for specific agricultural or conservation projects (such as the Mache-Chindul Reserve Management Plan Update prepared by CDC-Ecuador, Conservation International, and Ecopar). These secondary sources were helpful in providing missing information about areas obstructed by clouds in the principal satellite images. Rectification was achieved by establishing between 25 and 50 control points, depending on the topographic characteristics of each zone. ERDAS IMAGINE 8.4 was used to determine the coordinates of the control points and provided mathematical models and nearest neighbor methods for rectification of a majority of the images. A combination of methods using ArcGIS Desktop and IMAGINE were used to interpret vegetation types from the satellite images, including calculation of vegetation indices and semiautomatic image classification. Direct visual interpretation and consultation with area specialists were used to resolve interpretation of questionable areas. A low pass filter was applied to the images to simplify the classifications. Finally, ArcGIS Desktop was used to convert the images from raster to vector format, and standard cartographic elements were added to create the final Equatorial Pacific Ecoregion map. Optimization Algorithm with an ArcView InterfaceParticipants made use of an ArcView application called Sites 1.0 that facilitated the design of a portfolio that would most efficiently represent all of the species and ecosystems found in the ecoregion. Sites 1.0 was developed for TNC by researchers from the University of Queensland, Australia, and University of California, Santa Barbara, using heuristic algorithms for representative site selection exercises (www.biogeog.ucsb.edu/projects/tnc/overview.html).
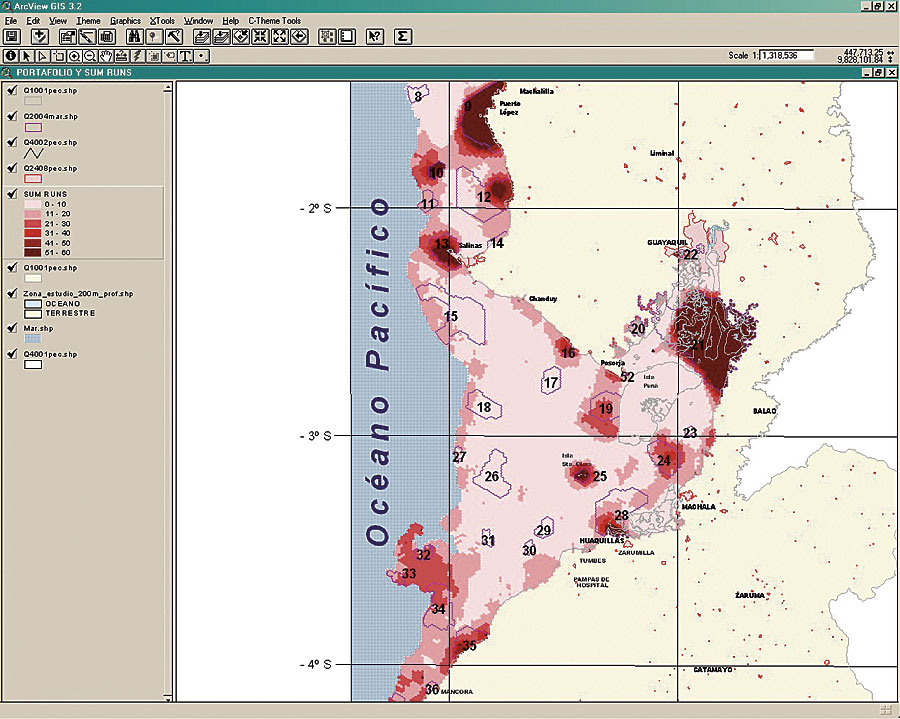
"Sites provided essential analysis tools for manipulating the variables of more than a thousand conservation elements," says Marcelo Guevara, TNC Equatorial Pacific Team Project coordinator, "including species and ecological systems combined with multiple threats and environmental variables, to prepare the ecoregional assessment unit analysis. Without its help, planners, technicians, and decision makers would have had a difficult time evaluating all of the possible site alternatives that might meet the required conservation characteristics and goals." The application used the following variables to generate possible scenarios:
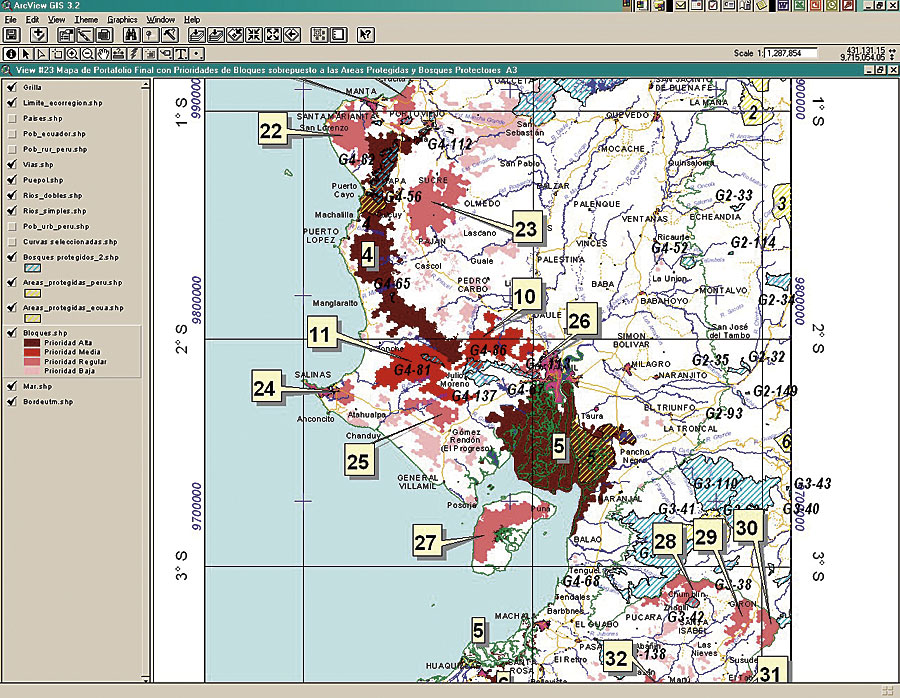
Application Methodology and ResultsHexagons of 150 hectares were used for the analysis unit; a total of 23,052 units were created for the marine ecoregion alone. Main data inputs for running the algorithm were the cost layer generated by a suitability analysis, distribution of conservation elements with their goals, and a boundary length modifier of 0.21. In addition, two sites were mandated for inclusion in the portfolio because they represented irreplaceable sites for certain conservation elements but were not chosen on the initial runs of the algorithm due to their small size. A total of 120 runs of the algorithm were made, with three million iterations in each run. The final portfolio consists of 790,623 hectares distributed in 51 areas or sites. Twenty-four percent of the total ecoregion area is included in the portfolio. The majority of conservation elements fit more than 96 percent of the conservation goals, and all preexisting protected areas became part of the portfolio. Seventeen portfolio sites were scored as high or very high priority. These sites cover 496,968 hectares representing 63 percent of the total portfolio of sites and 15 percent of the whole ecoregion and are distributed among the tropical, mix, and subtropical zones. As a group, the biodiversity priority areas include 13 of the 15 intertidal systems, 30 of the 33 subtidal systems, six of the eight communities, and 56 of the 83 species conservation targets. "The sites with lower priority do not mean they have lower importance for biodiversity conservation because, in most cases, these reflect areas that lack information and should be considered for future research," Guevara points out. Lessons LearnedGuevara and his colleagues made the following recommendations based on their experience coordinating the binational effort:
For more information, contact Frank Biasi, TNC, senior conservation data architect (tel.: 703-841-4518, e-mail: fbiasi@tnc.org), or Marcelo Guevara, TNC Equatorial Pacific Team Project coordinator (e-mail: mguevara@tnc.org). |