Fall 2005
Fall 2005 |
|||||||
|
|
|||||||
Reality Check—A One-Day Visioning Exercise
Regional Growth Around Washington, D.C., Envisioned with GIS |
|||||||
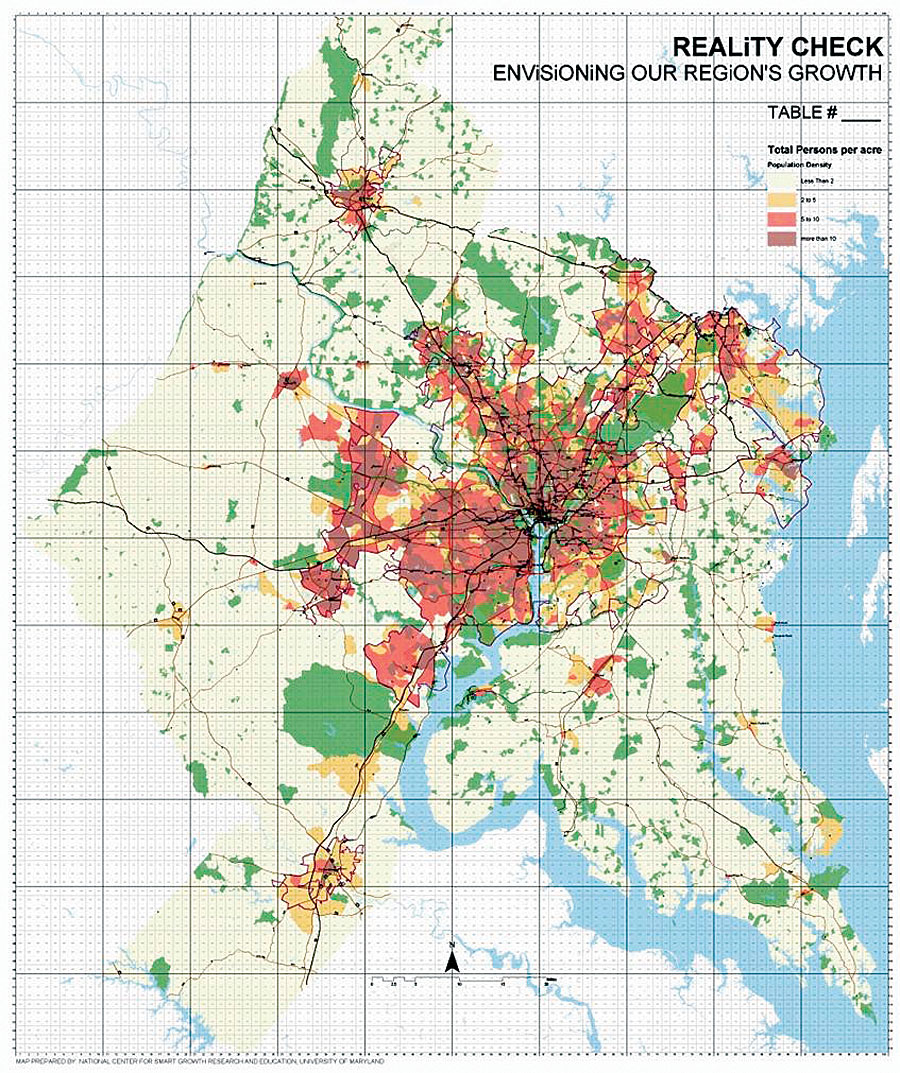
How do you make room for an extra two million people and 1.6 million new jobs that will come to your region in the next 30 years? Finding the answer takes some planning and vision. It also helps to get input from the communities where growth will be absorbed and services will be impacted. Common ChallengesMore and more cities are working with close-in suburbs and outlying agricultural and farming communities in a regional approach to planning. As city land becomes scarce, housing prices rise. People seek affordable housing that may be several counties from where they work. In an all too familiar scenario, farmland and forests disappear, commute times increase, transportation corridors jam, and life becomes more challenging. These types of issues were explored during Reality Check, a one-day visioning exercise held in Washington, D.C. The exercise, sponsored by Fannie Mae, the Fannie Mae Foundation, the Smart Growth Alliance, and the Urban Land Institute (ULI)-Washington, brought together a diverse group of partner and stakeholder organizations from Maryland; Virginia; and Washington, D.C. As part of the interactive exercise, participants envisioned scenarios for sustaining the regional economy, as well as quality-of-life issues related to housing density, proximity to transportation, and open space for parks and preserves. PreparationReality Check was modeled after similar exercises in Chicago, Illinois, and Los Angeles, California. Preparation began with the development of a basemap of existing conditions in the region by a team from the University of Maryland's National Center for Smart Growth Research and Education. Six-foot by eight-foot copies of the basemap were used by participants during the exercise. The challenge was to synthesize existing household, economic, and infrastructure data for display in workable, one-square-mile grids.
To build the basemap, a team from the National Center for Smart Growth led by Executive Director Dr. Gerrit Knaap, Associate Director John W. Frece, and doctoral candidate Arnab Chakraborty collected data on residential development, employment, economic development activity centers, transportation networks, protected lands, federal installations, topographical features, and the locations of cities and towns. The Maryland team also filled in missing infrastructure, topographic, and demographic data. Colleagues from Virginia Technology's Metropolitan Institute supplied needed data from jurisdictions in Virginia. Through a combined effort, GIS layers for rivers, roads, transit stations and rail lines, highways, federal installations, protected areas, place-names, and other similar features were collected. Jurisdictional boundaries were intentionally omitted from the basemap to encourage participants to think regionally. In addition, data from the U.S. Census Transportation Planning Package provided tabulations of households and workers—summarized by place of residence, place of work, and worker flows between work and home. Population figures from the U.S. Census Transportation Analysis Zones were converted into data keyed to individual polygon grids that overlaid the map in individually numbered, one-square-mile blocks. With that information, it was possible to compute the existing number of households and jobs within each grid. Says Knaap, "One square mile is considered an acceptable grid size because of the way it relates to the standard generally used for transit-oriented development, which is usually defined as development within a half-mile radius of a transit station." It was also the perfect size for stacking color-coded LEGO blocks, which would be a fundamental and fun component of the Reality Check exercise. In advance of the exercise, the National Center for Smart Growth team established a methodology to translate the people and jobs—represented by the LEGOs placed on the maps—into five sets of indicators:
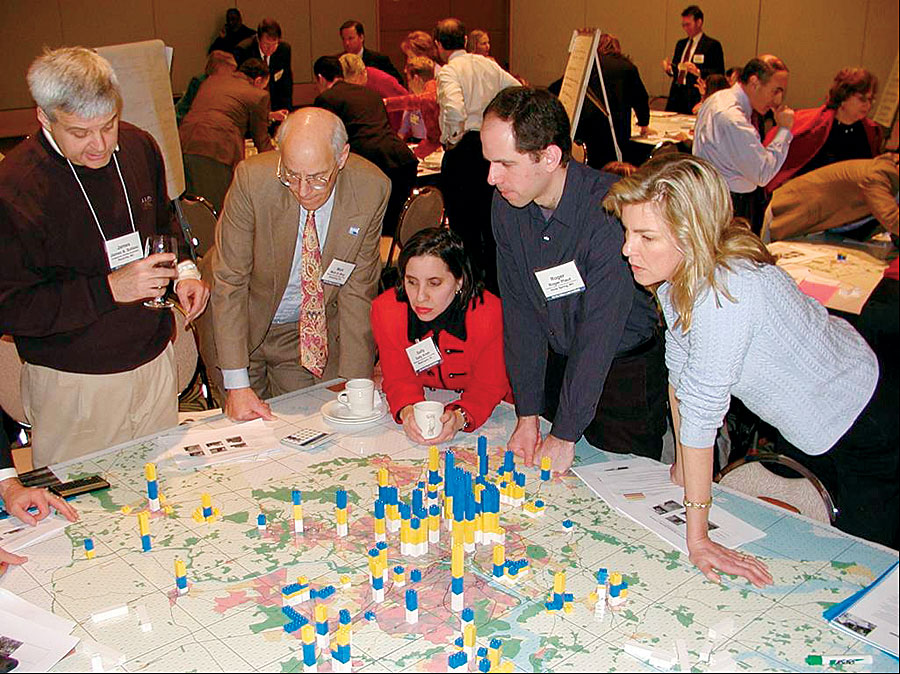
The ExerciseOn the day of the exercise, 300 participants were organized into teams of 10, seated at 30 tables, and given three hours to plan where all the new growth should go that would be coming to the region in the next 25 years. Each team developed a list of principles to guide its development decisions, exchanging points of view about ways growth could add value to the regions' economies without damaging the environment. Each team then began the process of allocating jobs, housing, and mixed-use areas in the one-square-mile grids on the regional basemaps.
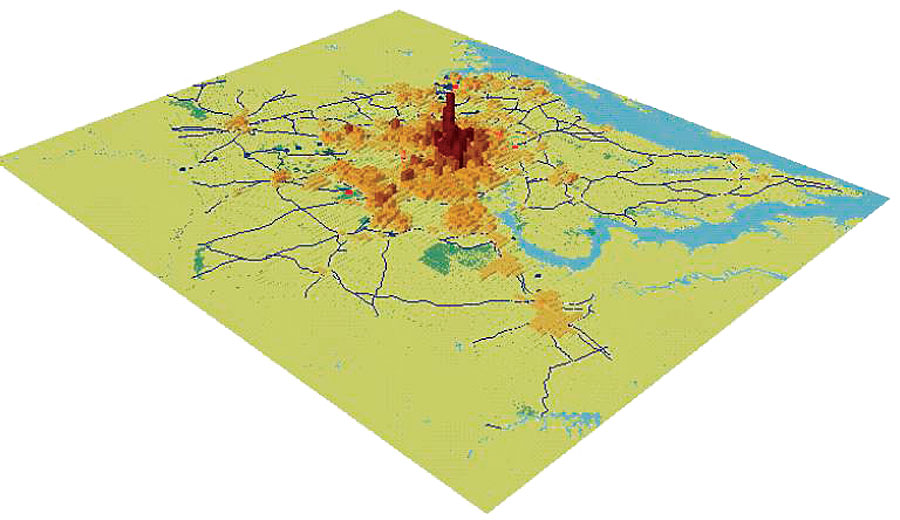
Working with color-coded LEGO blocks, each team had to place 280 yellow blocks (each representing 3,000 people) and 270 blue blocks (each representing 6,000 jobs) into the grids on their maps. In making their decisions, they had to consider impacts on area traffic, air quality, farmland, and housing demand. To calculate the indicators, every LEGO was counted to determine which were placed inside grid cells that were within one-half mile of transit, inside the Capital Beltway, within the urban envelope, or on the periphery of the region. A separate calculation was made to determine the balance of jobs and housing within larger "super blocks." The calculation was evaluated for a regional score using standard deviation measures. Student volunteers performed a critical role in collecting summary data from each table. The volunteers, organized by Chakraborty, included 30 scribes plus alternates, 30 computer operators plus alternates, and four rovers proficient in GIS to provide assistance to operators at individual tables. Chakraborty and two other computer operators staffed the central server. After reviewing and finalizing their decisions, participants at each table reported their allocation of households and jobs to their computer operator. Each operator tallied the indicators for the table in an Excel spreadsheet to show the existing households and jobs, the increment of households and jobs added by the table's participants, and the cumulative level of households or jobs. Next, using ArcView desktop software, the operators turned the incremental data into 2D maps for each table. Using ArcGIS 3D Analyst, they turned the cumulative results of each table's actions into 3D maps. Synthesis and AnalysisAll 30 tables were connected to a network, and the indicators and maps from each table were fed to a central server in which operators listed the indicators by table, developed synthesis maps showing the average household or job placement at all 30 tables, and produced agreement maps that showed the grids in which there was the greatest and least amount of agreement among the 30 tables. The steps were as follows:
The agreement maps and 2D and 3D maps were inserted into a PowerPoint template. Knaap supervised the operation. For more information, visit www.washington.uli.org and www.smartgrowth.umd.edu. |