Fall 2009
Fall 2009 |
|||||||
|
|
|||||||
USGS History, Part 1: 1884�1980
125 Years of Topographic Mapping |
|||||
|
By E. Lynn Usery, Dalia Varanka, and Michael P. Finn, U.S. Geological Survey See Part 2 in the Winter 2009/2010 issue of ArcNews.
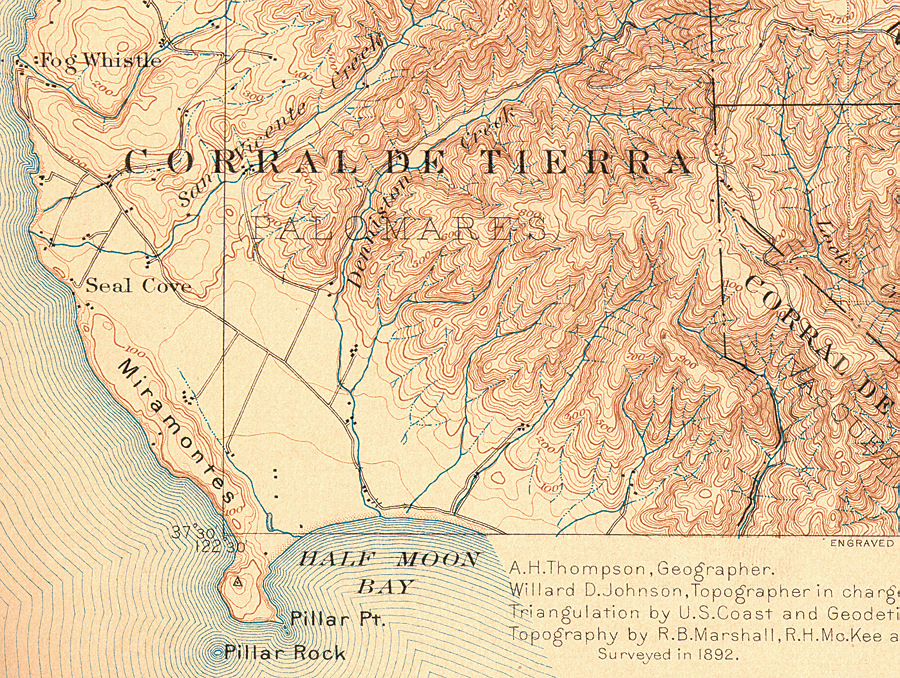
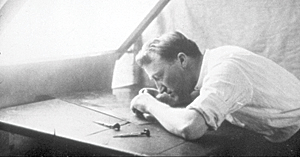
On December 4�5, 1884, John Wesley Powell persuaded the U.S. Congress to authorize the U.S. Geological Survey (USGS) to begin systematic topographic mapping of the United States. During the next 125 years, mapping techniques evolved from field surveys through photogrammetry to the computer-based methods currently used, and the scales and content of the topographic maps changed. It is the purpose of this two-part article to provide details of the USGS mapping processes through time and to help demonstrate that innovations by USGS employees and provision of public domain geospatial data helped spur the evolution and development of digital GIS and the commercial market for geospatial data and products of today. This first article describes topographic mapping developments prior to widespread use of GIS. In the late 19th century, surveyors created topographic maps in the field. They measured a series of points in the field, using tape and compass traverses with elevations determined with an aneroid barometer and used in a process known as field sketching to draw a terrain representation using contours. The introduction of the plane table and alidade, which could measure vertical angles, point positions, and elevations much more rapidly, greatly increased the accuracy of data shown on topographic maps but still required the surveyor to field sketch the contours after control points had been identified. The aid of a visual three-dimensional model in the office to construct the surface representation awaited the development of photogrammetry. During this time, USGS maps were created at scales of 1:250,000 for 1-degree areas and 1:125,000 for 30-minute areas. The scales were increased with time, and by 1894, most of the maps were created for 15-minute areas and produced at a scale of 1:62,500. Features shown on the maps included civil divisions of state, county, township, and city or village; public works, including railroads, tunnels, wagon roads, trails, bridges, ferries, fords, dams, canals, and acequias; hypsography with contours and floodplain representations; and miscellaneous features of forest, sand, and sand dunes. The reproduction of maps from the original field sketches used a lithographic printing process based on copper plates. The image of the topographic features was engraved on the copper plates. A three-color process was used with civil divisions and public works in black, hydrography in blue, and hypsography and miscellaneous features in brown. USGS cartographers commissioned for service in the Army Corps during World War I brought back knowledge of aerial photography. Throughout the 1920s, USGS experimented with photogrammetry, but it was not until the 1930s during the Great Depression, when the Tennessee Valley Authority needed complete topographic maps of the entire Tennessee Valley and was under time constraints for mapping, that USGS established a multiplex mapping office in Chattanooga, Tennessee. The ability to view a three-dimensional terrain surface by doubly reflecting the overlap area, or stereomodel, of a pair of stereophotos in a multiplex stereoplotter effectively replaced the requirements of field sketching. An operator could fix a vertical floating mark at a preset elevation in the stereomodel and trace contours to represent the terrain. Similarly, tracing a road or other planimetric feature in the stereomodel, but allowing the mark to change elevation along the feature, provided recording of all required planimetric features for the topographic map. After 1942, USGS used pen-and-ink drawings that were photographed to film separations, eliminating the need for copper plates. After a few years, the pen-and-ink process was replaced by engravers and scribe coat. The scribe coat replaced the film in the pen-and-ink process and could be used directly for photographic reproduction. The 1:24,000-scale 7.5-minute mapping program resulted from demand for more detail on the topographic maps. With the larger scale, USGS included almost 200 features separated into color groups for the five color plates to be used in the film-based reproduction process. The five plates included cultural features, such as roads shown with casings, buildings, and much of the type used on the map on a black plate; road fills, urban tints, Public Land Survey lines, and other features on a red plate; woodland tint and other vegetation on a green plate; hydrographic features on a blue plate; and contours, depressions, and other hypsographic features on a brown plate. The color separations were composited on a five-color lithographic press. USGS widely adopted photogrammetry as part of the mapping process after World War II, and USGS employees developed innovations in the production workflow and instrumentation. Russell K. Bean of USGS invented the Ellipsoidal Reflector Projector (ER-55) for which he was awarded a patent in 1956. The ER-55 became a replacement for the multiplex stereoplotter for USGS and was later manufactured and marketed by Bausch & Lomb as the Balplex stereoplotter. Also, during this period, the Kelsh stereoplotter, invented by Harry T. Kelsh of USGS, was widely adopted. A USGS innovation for the Kelsh and other optical projection stereoplotters was stereo image alternation (SIA), which operators often called the �squirrel cage� because of the rotating shutters inside a short metal tube; when viewed with the naked eye, SIA sequentially presented the left photo to the left eye and the right photo to the right eye to form the stereomodel. Additional innovation and developments provided USGS with solutions for stereoplotting, aerotriangulation, point measurement, and other photogrammetric operations. The Kelsh stereoplotters were used in areas of moderate to high relief, but low-relief areas, such as along the coasts and large parts of the Great Plains, required the capabilities of the "heavy" stereoplotters that used projection by mechanical rods. These stereoplotters included the Wild A8 and B8; the Kern PG-2; and others of German, Swiss, and Italian manufacture. The Kelsh and the heavy plotters were used until completion of the 7.5-minute topographic map series in 1991; however, additional innovations led to the concept and technology for producing orthophotos in the 1960s. The development by USGS of the orthophoto concept and building of a practical orthophotoscope by Bean, with a patent in 1959, led to the production of orthophotoquads—rectified aerial photos. Orthophotos became a standard product of USGS and later served as a base for the 7.5-minute topographic maps. Many other innovations affected the mapping process, such as the measurement of angles in the field with instruments, including transits and theodolites. Distances were measured with electronic distance measuring units using microwave technology and, later, lasers. The development of computers may represent the greatest technological innovation to change the mapping process, and USGS employees were quick to embrace this technology. In the 1960s, USGS developed the AutoPlot, a device that used stepping motors to move scribing engravers to create a scribe coat negative of the topographic map neat line (latitude and longitude lines that bound the quadrangles) and horizontal pass points.
After 1970, USGS embarked on three different tracks using digital technology. First, it initiated a massive program to manually digitize existing maps to create a product with an arc/node data model, known as a digital line graph (DLG). During the same time, USGS used advances in photogrammetric technology that generated an orthophotograph to simultaneously produce a digital elevation model (DEM). Both DLGs and DEMs were placed in the public domain. The second track was the automation of the map production operation. The Digital Cartographic Software System development included retrofitting analog stereoplotters, such as the PG-2, with three-axis digitizers to collect and record the x,y coordinates and attributes of geographic features from the stereomodel to a magnetic tape. The tape later was used to drive a large-format automatic plotter, a Gerber 4477, to engrave the map data onto the scribe coat, or to drive a photohead device to expose a film negative. USGS also developed a cartographic interactive editing capability, referred to as the Graphic Map Production System. The scribe coats or film negatives from the final editing process became the color separations necessary for the five-color press to create the lithographic map. The final track was the development of a land-cover data-generating program, Land Use Data Analysis. The program also developed software, the Geographic Information Retrieval and Analysis System, to support vector graphics and analysis from an arc/node data model. This data became the first complete land-cover dataset for the conterminous 48 states and, as with the DLG and DEM data, was provided in the public domain. Throughout this period, USGS scientists were developing innovative computer-based data products and hardware/software systems that were made directly available to the public. A software example that persists today is the General Cartographic Transformation Package, written in the 1970s by Atef Elassal, a USGS employee. The computer code in FORTRAN IV (later converted to C and, in 2009, available in C++) can transform data to any of 21 different map projections. This software was the basis of map projection packages that became part of GIS software, which would have its commercial debut in the 1980s. About the AuthorsE. Lynn Usery is a research geographer and director of the U.S. Geological Survey Center of Excellence for Geospatial Information Science (CEGIS). He received a B.S. degree in geography from the University of Alabama and M.A. and Ph.D. degrees in geography from the University of Georgia. He has over 20 years' experience with USGS and 17 years as professor of geography at the University of Wisconsin, Madison, and the University of Georgia. Dalia Varanka is a research geographer with U.S. Geological Survey. She received her B.A. degree from the University of Wisconsin, Green Bay, in regional and urban analysis (1978); her M.A. degree in geography at the University of Illinois at Chicago (l987); and her Ph.D. degree in geography from the University of Wisconsin, Milwaukee (1994). Michael P. Finn holds a B.S. in geography with a minor in cartography and map technology from Southwest Missouri State University (now Missouri State University) and an M.S. in civil engineering from Virginia Polytechnic Institute & State University. He has worked as a computer and IT specialist and a research cartographer with the U.S. Geological Survey for the past 10 years. More InformationFor more information, contact E. Lynn Usery, research geographer and director, CEGIS, U.S. Geological Survey (e-mail: usery@usgs.gov); Dalia Varanka (e-mail: dvaranka@usgs.gov); or Michael P. Finn (e-mail: mfinn@usgs.gov). See Part 2 in the Winter 2009/2010 issue of ArcNews. |