Fall 2009
Fall 2009 |
|||||||
|
|
|||||||
GIS and the Science Behind Tapping Wind Power Offer Insight on the Resource's Feasibility
Renewable Energy—No Longer the Impossible Dream! |
|||||||
Highlights
Just then they came in sight of thirty or forty windmills that rise from that plain. And no sooner did Don Quixote see them that he said to his squire, "Fortune is guiding our affairs better than we ourselves could have wished. Do you see over yonder, friend Sancho, thirty or forty hulking giants? I intend to do battle with them . . . With their spoils we shall begin to be rich . . ."
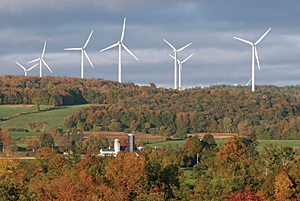
When Miguel de Cervantes wrote of the impetuous and noble hero Don Quixote 400 years ago, he could not have imagined that one day environmental scientists and energy analysts would "dream the impossible dream" of stocking the electric grid with the power of the wind. Nor could he have envisioned the hulking giants that now line many a horizon, the 400-foot-tall wind turbines each wielding three 130-foot steel blades and weighing 8.5 tons. When he talked of tilting at windmills, the Spanish literary master would not have guessed that public utilities, private companies, and investors would someday look to the wind to "beat the unbeatable foes" of waning fossil fuel supply and deleterious carbon emissions. Wind energy now accounts for 1 percent of the United States' power supply, and forecasts from the U.S. Department of Energy say that figure could reach 20 percent by 2030. While wind farms crop up across the country's windiest terrain, critics point to the need for new transmission lines and the variability of the wind. Many citizens support the idea as long as it's "not in my backyard." Despite criticism, wind power is touted as one of the cleanest, most reliable renewable resources dreamed up so far. But is harnessing wind power on a wide scale as quixotic as dreaming the impossible dream? In 2008, the United States surpassed Germany as the world's biggest generator by volume of wind energy. The amount of wind power the United States generates has doubled in the last two years, according to the American Wind Energy Association (AWEA), a trade group for wind power developers and equipment manufacturers. An investigation into the solid science of wind power facility development clarifies the potential and reliability of this blustery resource. Twenty-eight U.S. states have set renewable energy mandates and are determined to woo wind developers. A Nebraska utility brochure boasts, "Nebraska has wind. In fact, the state ranks sixth in America for wind development." An energy company in Minnesota is announcing plans to buy an interstate transmission line and develop wind energy to replace coal-generated electricity. One county in Montana is distributing a wind map book compilation of all necessary data to entice investors. Harnessing the Wind
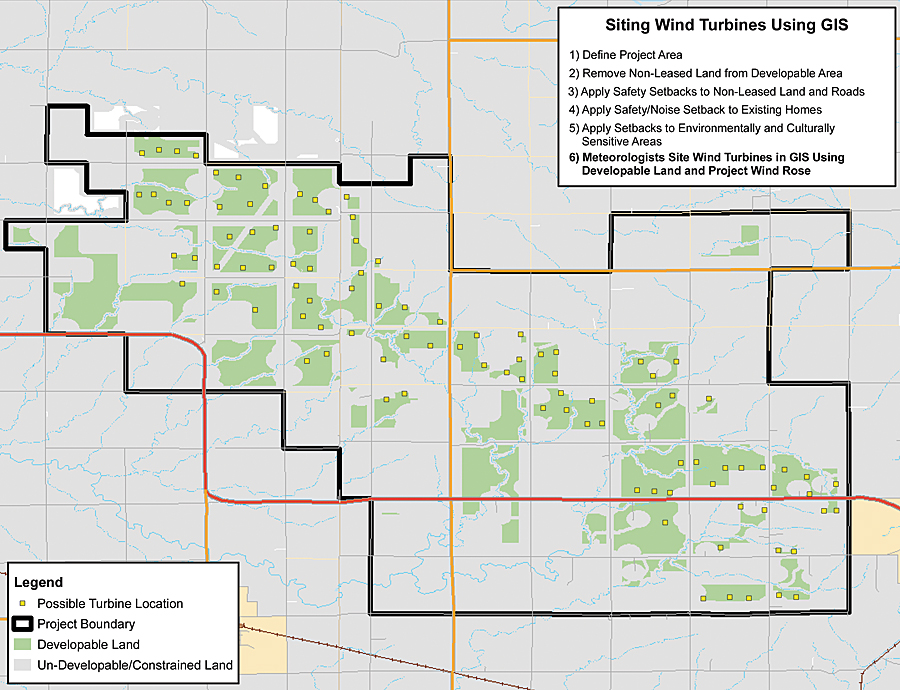
Wind turbines convert the kinetic energy in moving air into rotational energy, which in turn is converted to electricity. Humans have used wind power for centuries to move boats, grind grain, and pump water. Timeless and simple as it may seem, development of a wind power facility is much more complex than staking a pinwheel in the breeze. Iberdrola Renewables is the largest developer of wind power in the world. It has a flurry of wind power projects in the works as utilities aim to reduce dependence on nonrenewable energy. Modeling the feasibility of these projects requires studying location, wind speed, environmental concerns, and other variables. There was a time not long ago when the company's development teams of meteorologists, engineers, environmental permitting staff, and land agents only had paper maps to work from. These paper maps didn't show property ownership, wetlands, county- or state-required safety setbacks, rights-of-way, or environmental and cultural resource sites. Knowing that there had to be a better way, Iberdrola investigated available technologies that would help it organize and analyze complex data and decided that GIS from Esri, which was a familiar platform for engineers in the electric and gas industry, would dramatically improve the quality and accessibility of its data and maximize the efficiency of decision making. ArcGIS Desktop and ArcGIS Server became fundamental to the business model of the company. Smart Layers for Smart MapsThe life of a wind farm project starts with a look at potential plots of land. Most developers require land within a prescribed distance of a transmission line to tie in power to the grid. If the wind is strong and steady, developers may decide to build their own transmission line. By loading utility data into the GIS, researchers can quickly see existing transmission routes and estimate the benefits of accessing existing electric lines. Another important consideration for developers is landownership. State and county land-use data in the GIS identifies areas under development restrictions from the Bureau of Land Management and those requiring right-of-way grants. If land is privately owned, developers will have to obtain consent from individual landowners. A layer of constraints is added, marking areas that are environmentally protected for migratory flight paths or other animal activity. Other site restrictions are military bases and airports where developers must consider radar interference and Federal Aviation Administration regulations. Wind data is equally crucial to researchers, who add a resource layer to ArcGIS detailing wind speed and reliability. Meteorological data is continuously collected during a one- to five-year period using tower-based anemometers and vanes mounted at several height levels up to 60 meters aboveground. Wind power can be classified into wind power density classes ranging from one (poor) to seven (excellent). For example, a wind power class of four has an average wind speed of 15.7 to 16.8 mph at a height of 50 meters aboveground. In addition to site research, meteorologists use wind data stored in ArcGIS Server to help design the layout of a wind farm by identifying wind direction, strength, and location. Site Scouting Field Trip"Almost all the wind power facility layouts can be done in the GIS, with maybe one or two visits to the field," says Tyler Hoffbuhr, GIS analyst and manager with Iberdrola Renewables. "Now we can stock the GIS with U.S. Geological Survey maps, property lines, aerial photography, and detailed topography data to see how the buildable area matches up with the wind data."
When development teams visit a proposed location, they collect site-based data to compare with digital information and maps within the GIS. Using a mobile device equipped with GPS and GIS, the team is able to update data from the site and make any necessary adjustments to the facility layout. "GIS enables us to reach our goal of finding the best wind areas while causing as little impact as possible to wildlife and the environment," says Hoffbuhr. "Locating the right site can be done quickly and accurately with publicly available data and GIS technology." In total, wind power facility development is about a four-year process that involves the site research and data collection, as well as procurement of government permits, landowner permission, funding, and the physical resources. When the plans are ready, developers hand over the project to the construction team. "Once all the initial research is done, construction of the wind power complex happens quickly, sometimes in four to six months," says Laurie Jodziewicz, manager of siting policy, AWEA. "Projects under construction right now will be online and delivering energy within a year or less." Once a wind farm is up and running, operators continue to use GIS to help gather inspection and operational data. Since wind energy is variable, utility companies have to figure out what to do when the wind does not blow. With ArcGIS technology, operators can model and predict how well the wind will perform in the next few hours or days and accurately match energy production with demand. But Will It Work?Healthy government incentives are driving much of the wind power development in the country. A report led by the Department of Energy's National Renewable Technology Laboratory in Golden, Colorado, reiterated predictions that wind energy will claim a 20 percent share of electricity production in the next 10 years. The report called the forecast "ambitious," but "feasible." The energy industry is already on board with more than 9,000 new wind farms under construction in the United States and nearly 20,000 existing. "With sophisticated site development technology and incredible wind resources, wind energy is becoming increasingly valuable," said Esri's utility industry expert Bill Meehan. "We are now seeing utilities integrate wind power into the electric system to supplement fossil fuels. Wind is a cost-effective, nonpolluting energy source that will continue to be one answer to international energy concerns." More InformationFor more information, please visit www.iberdrolarenewables.us. |