Spring 2002
Spring 2002 |
|||||||
|
|
|||||||
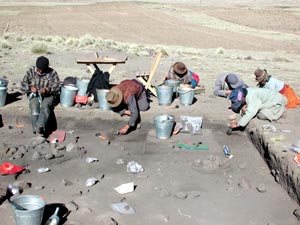
Jiskairumoko--Near Peru's Lake Titicaca
Recording Large-Scale Archaeological Excavations with GIS |
|||||||
|
By Nathan M. Craig, Department of Anthropology, University of California, Santa Barbara, California
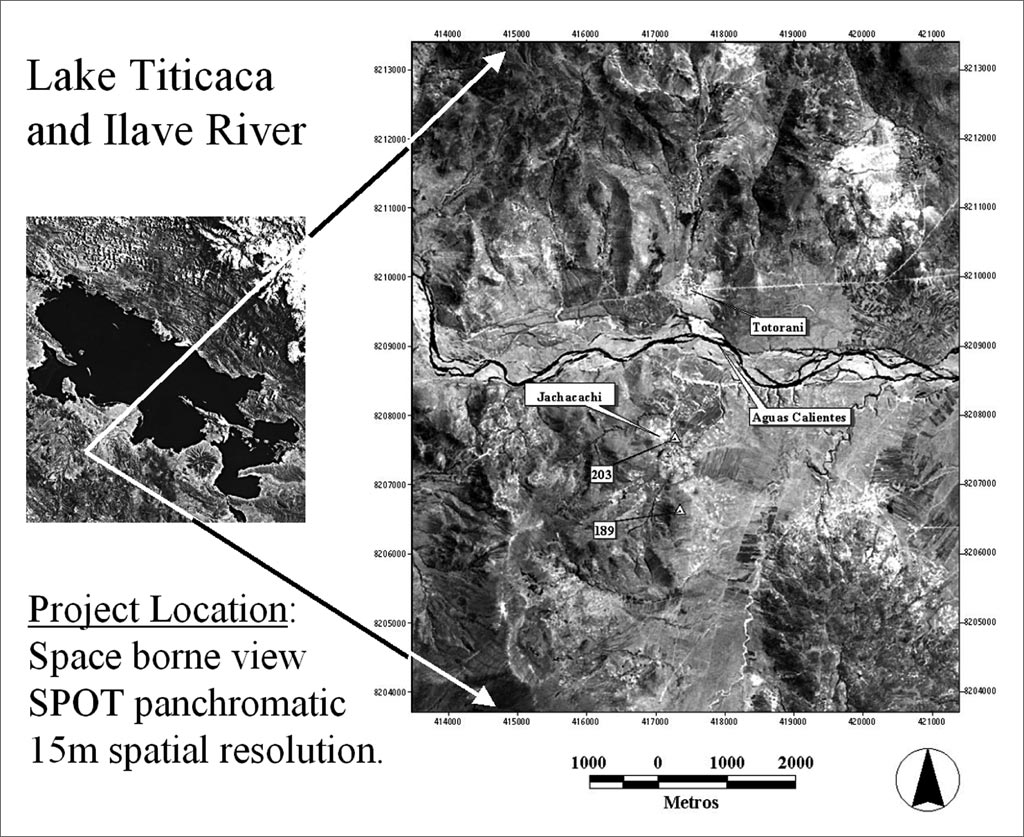
The Andes are one of the few places in the world where complex political systems have developed in situ. This region was also the only place in the New World where large animals were domesticated. Together, these circumstances make the Andes an extremely important region for archaeological research. However, the transition from hunting and gathering to settled village life, an important cultural change that sets the stage for later developments in prehistory, remains poorly understood in many parts of the Andean region including the Titicaca basin. This basin forms an extremely important ecological feature in the Andean high-elevation altiplano environment. It was a likely center for the domestication of camelids (like llamas and alpacas), and later it saw the emergence of the Tiwanaku Empire. Over the past three years, the Ch'amak Pacha Archaeological Research project of the University of California at Santa Barbara, headed by principal investigator Dr. Mark Aldenderfer with funding from two National Science Foundation grants, has been developing site-level GIS-based methods for recording large-scale excavations directly in the field to document the early stages in the emergence of cultural complexity at an archaeological site called Jiskairumoko that is located along the Ilave drainage of the southern Lake Titicaca basin in Peru. The project's work at the site has three main goals: (1) understanding the formation of settled village life, (2) understanding the process that led to the domestication of local plants and animals, and (3) documenting when signs of social differentiation began to appear. A comprehensive understanding of the transition from hunting and gathering to settled village life requires tracking changes in community organization over time. We would like to know when community structure began to show evidence of reduced residential mobility, develop estimates of the number of occupants at residential bases during various periods of prehistory, and document the presence or absence of ritual architecture during the different occupational phases at Jiskairumoko.
Intrasite spatial analysis (also known as distributional analysis) has been instrumental in expanding upon the kinds of inferences that can be drawn from archaeological research. However, while intrasite or distributional analysis has been at the forefront of refinements in excavation methods and the interpretation of results, the methods archaeologists typically use for recording intrasite spatial data are quite time-consuming. Ethnographic studies of living hunting and gathering societies demonstrate that patterns of community structure hold clues to the degree of residential mobility, patterns of relatedness and sharing among group members, and the number of occupants of the community as a whole. However, these studies also demonstrate that, while significant social information is embedded in community layout and is expressible by spatial metrics, archaeologists hoping to collect comparable data are going to have to dig horizontal exposures far larger than has been possible in the past using traditional excavation methods. Using existing methods for documenting excavations with detailed recording only permits limited exposures per field season, providing a small picture of horizontal patterning that occurs across broad spaces. On the other hand, coarse resolution recording permits broad exposures per field season but with limited contextual information. To collect the amount of detailed information necessary to interpret social information embedded in community layout, a system using Esri GIS software was developed that allows greater speed and accuracy in the search for exposure and recording of buried archaeological deposits. Using a variety of instruments, including magnetometers, ground penetrating radar, total stations, digital cameras, and GPS receivers with laptop and pentop computers running ArcView in the field, we can rapidly collect and explore data directly at the site. Using ArcView 3.2 for data collection and ArcGIS 8.1 during laboratory processing to solve our one-to-many cardinality issues through the use of relationship classes, all of the various forms of spatial data that we collect can be organized into a common coordinate system while they are recorded and integrated into the master database. Geophysical remote sensing detectors like the magnetometer and ground penetrating radar allow a prospective look at large areas of the site in search of anomalies likely to represent buried domestic structures or associated thermal features such as fire hearths. Use of total station permits very accurate recording of the depth and topography of excavations that are targeted for the testing of geophysically identified subsurface anomalies. Overhead photographs from digital cameras are georeferenced or rubber-sheeted into the site's excavation matrix. The photographs are used as a basemap for digitizing the horizontal distribution of soil features, such as trash middens, as well as for plotting the distribution of individual artifacts like bones and flaked stone debris. GIS permits matching of geophysical survey data with excavated areas of the site. This improves our interpretation of the geophysical data and lets us develop better expectations about what geophysically detected anomalies from unexcavated areas are likely to represent archaeologically.
Excavation of surfaces is done in natural rather than arbitrary levels as the hope is to expose buried prehistoric living surfaces. Excavation in natural levels creates conditions where the volume of material is not consistent across a level or between levels. Distributions of artifacts' densities are critical to an understanding of site structure, and these distributions are a function of volume. Therefore, one can see that accurate estimates of volume are essential and must be established empirically. The depth of each newly exposed level is measured with a total station using a 50-cm sampling interval that is judgmentally augmented when the natural undulation of the exposed surface requires additional data points. This topographic information from each level is imported into ArcView where, using the ArcView Spatial Analyst extension, a grid is interpolated using the spline algorithm with a spatial resolution of 10 cm. Once these surfaces have been interpolated, volumes can be estimated using the Map Calculator. However, as will become evident, what is needed is not the volume of the level itself but rather the volume of each individually excavated space that is represented by a polygon. As mentioned, features are digitized on pen-top computers using georeferenced photographs as a basemap. These same features are excavated separately within each level so that the distribution of artifacts within house floors can, for example, be compared to the distribution of artifacts recovered from a spatially associated trash midden. In addition to dividing the excavation of a level into features defined based on differences in soil texture, color, and crumb structure, each level is arbitrarily subdivided into 50-cm squares. These squares are then superimposed on the archaeologically defined features in such a way that any given feature may be divided up into a number of component parts. The division of each block into 50-cm squares permits examination of variation in the distribution of artifact counts within and between features. However, one will recall that artifact counts are a function of volume, and because the site is excavated in natural levels, the volume of excavated material is not constant across space. What is needed is the volume of the level within each individual polygon representing a feature space that is excavated separately and has its own individual artifact counts rather than the volume of the entire level. In other words, knowing the volume of level 3 is not particularly useful. Rather what is needed would be something more like volume of house floor 1-quad 2 in level 3. To solve this problem, the Map Calculator is used to subtract a lower level from an upper level producing a grid representing volume at the spatial resolution of the raster data set, which in this case is 10 cm. Once a volumetric surface has been created, the summarize zones request available with the ArcView Spatial Analyst extension can be used to calculate the volume of every polygon in a level. By using the Field Calculator with this information, it is possible to divide artifact counts by the volume of dirt from which the count was derived, making comparison across surfaces excavated at uneven depth far more robust. Using traditional methods, artifact distributions are depicted in one of two ways. When artifacts are point-provenienced in the field, a distribution can be represented as a cluster of points. However, this is a time-consuming method of excavation recording that is not frequently used by American archaeologists. Most archaeologists working in the American tradition excavate in units with counts given as "cell frequencies," and the distribution of artifact counts from deposits excavated in this manner are generally shown with contour lines (also called isopleths) representing artifact density. Isopleth representation of artifact counts by units and features is very common in archaeology, but isopleth representation is intended to depict a continuous distribution of some statistical surface rather than discrete entities that are excavated separately. Differentiation by color (or choropleth representation) is a far more appropriate method of representing variability in artifact counts that are derived from bounded spaces intended to represent separate entities. While more appropriate cartographically, the method has seen only limited application for the representation of artifact distributions in archaeology. Use of site-level GIS makes choropleth representation of counts a straightforward task, and with the use of total stations along with interpolators, map algebra, and the field calculator, analysis of artifact distributions is quicker and more accurate. Use of the GIS as an infrastructure for collecting and organizing data directly in the field rather than after the fact has permitted excavation of an exceptionally large area of the site while maintaining high levels of accuracy in the recording process. The speed and accuracy permitted by the use of GIS in the field during the recording process is allowing rapid, high-resolution recording of large horizontal spaces. These methods permit archaeologists studying hunter-gatherers to examine relationships at the spatial scales that ethnographers recognize as important for understanding social processes. Field and laboratory work at Jiskairumoko continues. The technology is meeting and exceeding the project's basic needs. It is permitting new forms of analysis of archaeological material that were unanticipated. With each new field season and with the discovery of new archaeological features, elements of the system change to meet the new demands of the field season. For more information, contact Nathan Craig (e-mail: nathancraig@umail.ucsb.edu) or visit the Ch'amak Pacha Web site at titicaca.ucsb.edu. |