Spring 2005
Spring 2005 |
|||||||
|
|
|||||||
Helping Elephants Across the African Continent with GIS |
|||||||||
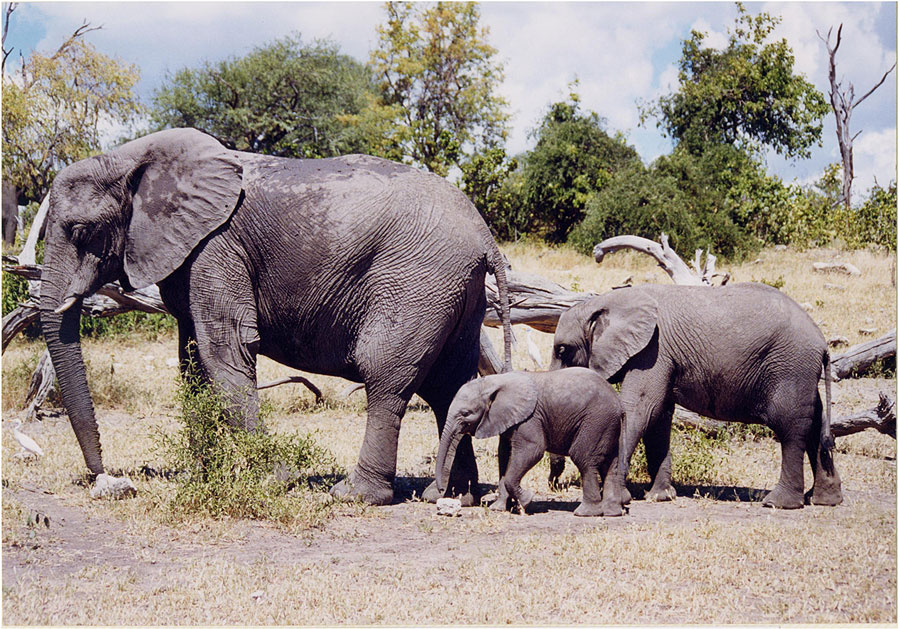
With adults measuring up to four meters high and usually weighing more than six tons, African elephants are the world's largest land mammals; yet in all their magnificence, their history is tainted by a constant battle for survival. Poaching, the most recent of the species' troubles, is estimated to have decreased the African elephant population from 1.3 million in 1970 to just 600,000 by 1989. However, research conducted at the University of Southampton, England, is revealing a brighter future. Over the last century, the human population on the African continent has dramatically expanded and subsequently sprawled into previously uninhabited areas. This has meant elephants and people have increasingly come into direct contact as their spheres of influence overlap. Consequently, conflict between humans and elephants has also increased as each species brings about land-cover changes undesirable to the other. As such, environmentalists have long recognized the need to manage this developing human–elephant interactivity. However, much of this management has focused on a local or, at best, regional scale. While seemingly effective, it neglects the holistic dynamics of the problem and often just transfers the trouble elsewhere.
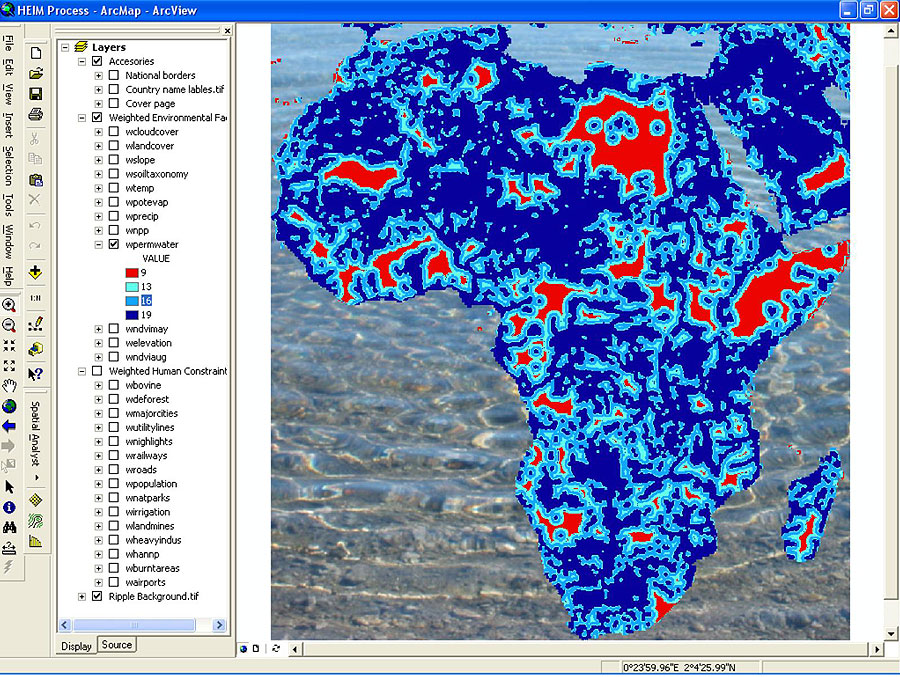
A pioneering new approach to resolve this predicament is emerging from work conducted over the past year by Matthew Shipton, a researcher at the University of Southampton. The result of this work is the Human–Elephant Interaction Model (HEIM) that predicts the spatiality of human–elephant conflict across the entire African continent. While the results do not have the spatial resolution of more local studies, they have revealed previously unknown trends that can be directly traced back to land management policies. The model also acts as a decision support system, leading those in authority to make decisions that will be effective on a long-term basis. For example, HEIM can provide a list of the most suitable relocation sites for specific problem herds, which can only be done with a model of significant geographic scope since elephant ranges span up to 500 square miles. HEIM is constructed in ArcView since it requires a wide range of geostatistical and spatial analytical tools to form the foundation of the spatial modeling and geoprocessing operations that are at its core. The ArcGIS Spatial Analyst extension was used in the development of the model, which is based on two datasets, both of which are primarily sourced from the American Geological Institute's Global GIS Database: Africa CD-ROM. The first dataset is a series of 12 carefully selected variables that attempt to outline the environmental characteristics of elephant ranges. This data ranges from remotely sensed normalized difference vegetation index calculations to slope maps to those detailing the distance to the nearest permanent water source. The second dataset is slightly larger (15 variables) and contains information on the human constraints that are imposed on an area's environmental suitability for elephant habitation. For example, this dataset includes data on human population density; land mine risk; and the location of national parks, major roads, and various industrial activities, including data on sustainable farming of both a pastoral and agricultural nature.
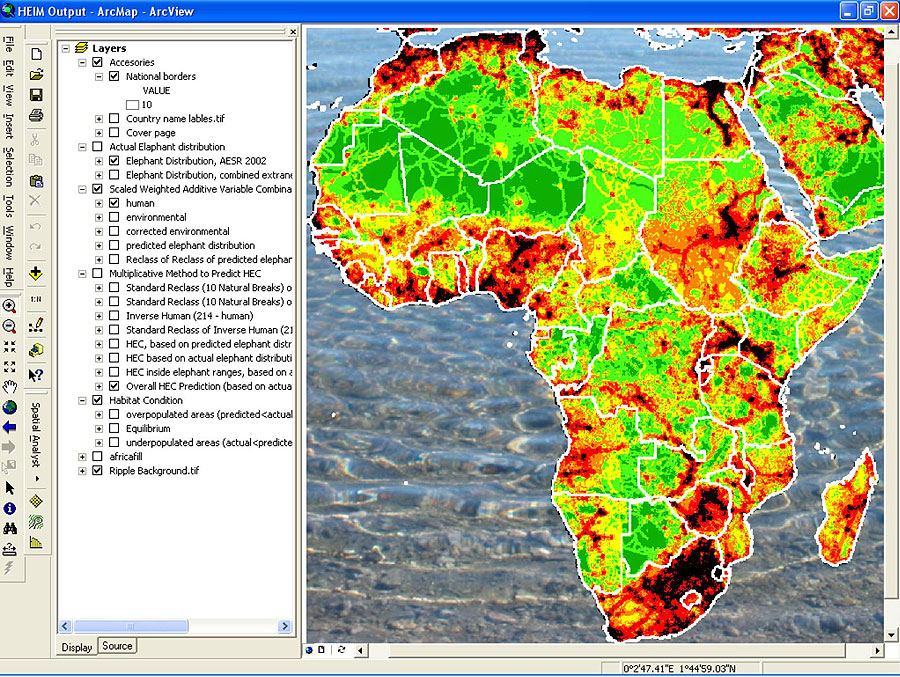
The variables in these datasets are independently weighted by a multiplicative matrix. This accounts for the varying magnitudes and intensities of the variables' impacts on elephant habitation. Moreover, because the variables are not all from the same source and the data they contain is collaborated in different ways, the matrix also gives some weight with regard to the accuracy, quality, completeness, age, and longevity of the data. Finally, the variables are calibrated with data from the African Elephant Status Report (2002), which was provided by the African Elephant Specialist Group. Known as "model fitting," this process emphasizes the importance of those variables that statistically best describe the actual distribution of elephants across Africa. The two datasets are then separately combined with the raster calculator function in ArcView using the ArcGIS Spatial Analyst extension to create two base images: one shows the suitability of the African environment to elephant habitation and the other shows the severity of human constraints that limit elephant habitation. These images are then overlaid, again using the raster calculator, in a way that does not bias the greater number of variables in the human constraint dataset, to create an image that predicts the spatial distribution of elephants across the whole continent (assuming that elephants occupy the areas that have the most suitable physical environment and the lowest level of human activity). This image is then correlated with the data from the African Elephant Status Report on the actual distribution of elephants as a form of model validation, giving an idea of the accuracy of the model's output.
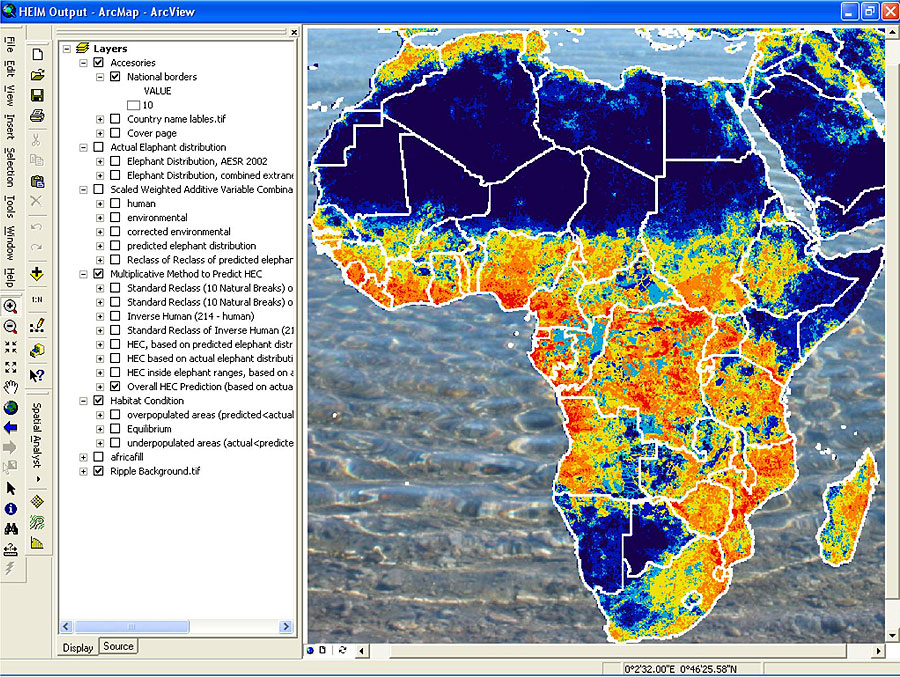
Once this is found to be acceptable, the severity of human–elephant conflict across Africa is calculated within specific error margins. This is done by again combining the two base images in ArcView but this time with the human constraints inversely scaled so the output gives the highest values to areas environmentally suitable for elephants with high levels of human activity. As a final form of model validation, ground control points were chosen across this image. These then had their relative level of human–elephant conflict confirmed or refuted through field observations by the charitable organization Living With Elephants and the Department of Geography and Environmental Sciences at the University of Zimbabwe. With the data collected, a final step was then taken to analyze the overall condition of the African elephants' range. This was done by reclassifying the predicted elephant distribution and actual distribution into 10 natural breaks. The raster calculator was then used to identify where the predicted value exceeded the actual value (overpopulated), where it was beneath the actual value (underpopulated), and where the two were equal (a population in equilibrium). This provides a further tool for environmental managers, since knowing the degree to which an environment is stressed has numerous significant consequences on the way it is managed. The model has been extensively tested and compared to proven ground data. The wealth of information contained within the model is now being analyzed so it can be used to further the effectiveness of conventional management projects. This analysis will provide a basis from which stakeholders can get a preliminary overview of the impact of specific management decisions. Moreover, it is desired that the model's spatial predictions of human–elephant conflict will be used as a foundation for national and intergovernmental strategic and tactical decisions regarding preemptive management to quell potential conflict zones—ultimately leading to a better life for African elephants. For further information, contact Matthew Shipton (e-mail: mds502@soton.ac.uk). |