Spring 2006
Spring 2006 |
|||||||
|
|
|||||||
Hosted by Montana Department of Public Health and Human Services
Disaster Preparedness Exercise Uses GIS |
|||||||
Unfortunately, disasters happen. They can be limited in scope or reach catastrophic proportions. They can hit rural, isolated areas as well as sweep through multiple jurisdictions, affecting lives, property, and the environment. To prepare for these events, communities hold emergency preparedness exercises. An emergency preparedness exercise is a simulation of an event, or series of events, designed to test emergency response systems. Communications, technology, existing resources, knowledge, and skills are tested to see if the systems work. Hopefully, the systems will work flawlessly, but sometimes investments need to be made for improvements. In the end, an exercise gives valuable information that can be used to enhance emergency services. Being prepared to respond to and recover from emergencies is a big responsibility and a continual challenge. Montana's Department of Public Health and Human Services (DPHHS) did just that when it participated in a four-day statewide disaster preparedness exercise known as Operation Last Chance One last year.
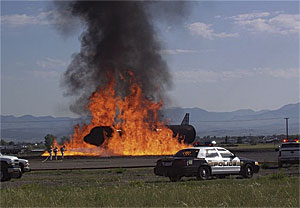
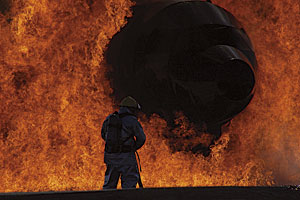
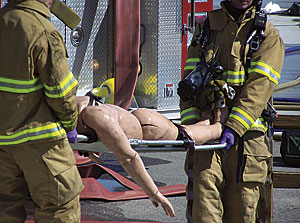
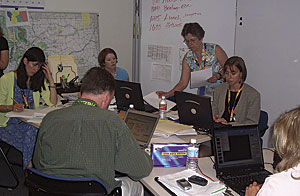
Designed to challenge emergency managers and test emergency response systems, the exercise improved disaster and emergency response in Montana. The exercise included participation from 59 of the 63 county and tribal health departments in Montana, as well as 26 hospitals and clinics. The first of the two-part exercise simulated the spread of pneumonic plague as high school campers returned home, as well as a chemical release from an airplane that crashed at Helena Regional Airport. Operation Last Chance One tested the ability of state and local health departments and their response partners to effectively coordinate and communicate during an emergency response. More than 500 emergency personnel and volunteers from more than 100 agencies and organizations participated in the exercise. One focus area of the exercise was information technology (IT)—how IT could be effectively used in the analysis and dissemination of information and how this information could assist in the event of a real emergency. The exercise was open to a few private technology companies; Esri and Esri Business Partner GCS Research were invited to participate. Volunteering in support of the DPHHS Emergency Operations Center (EOC) planning team, operating under the incident commander, the companies used ArcGIS Desktop (ArcView) software and ArcWeb Services. Exercise officials were then able to import, visualize, analyze, and create on-the-fly maps for communication and decision-making purposes, tracking the spread of disease over time. The DPHHS GIS team also exchanged information in real time with the Montana Disaster and Emergency Services GIS team to ensure that a common operational picture was established and shared by the participating agencies for disease surveillance, communication, and decision making. ArcView, along with the ArcGIS 3D Analyst, ArcGIS Network Analyst, and ArcGIS Spatial Analyst extensions, was used to demonstrate how existing geographic datasets and near real-time information—including hospital capacity, live weather, and traffic—could be displayed. This data was used from Web services and other distributed data sources and easily integrated within the Esri software framework. "GIS can be very useful in situations that require us to have a better integrated view of conditions on the ground," says Jim Aspevig, public health informatics manager, DPHHS. GCS Research demonstrated the value of GIS during the first scenario, a plane crash that included a chemical release of a suspicious white powder. ArcView and ArcGIS Spatial Analyst were used to show plume modeling, and ArcGIS Network Analyst was used to show optimized routing and distribution of the strategic national stockpile, mapping of resources for incident response, and demographic analysis for determining affected populations. The second scenario tracked a bubonic plague outbreak at a fictitious high school camp. ArcView and ArcGIS Spatial Analyst were used to trace the children from the camp back to their home counties in Montana, aggregate the data quickly, and analyze the potential spread of the disease.
The GIS Team engaged with the Planning Team and epidemiologists from the Operations Team to compare and contrast the results of epidemiological models against simulated real-world reports of suspected and confirmed pneumonic plague cases from around the state; also to investigate ways to improve the accuracy of spatiotemporal models in addressing the rural nature of Montana's geography. "In my opinion, the usefulness of graphic visualization made possible by GIS cannot be overstated," says Earl Hall, basic biodefense project manager at the University of Montana. "While the data necessary for a robust GIS application to public health emergencies in Montana may still be in its infancy, I am convinced that a commitment to data integration will ultimately prove beneficial to public health authorities. Predictive modeling of infectious disease spread, using GIS technology, is an area that deserves more attention." A crucial element of Operation Last Chance One was to test the ability of local, state, and federal health officials to share information and resources during a disaster response. Another goal was to test the ability of public health agencies to diagnose diseases and investigate and control their spread. "Working closely with the EOC Planning Team provided a real-world opportunity to demonstrate the value of GIS during an emergent public health crisis," says Dr. Alex Philp, president, GCS Research. "The value of a geospatial common operational picture was clearly demonstrated and we look forward to assisting DPHHS in substantiating the lessons learned during the training exercise." Says Bill Davenhall, health and human services industry manager, Esri: "GIS adds value to IT infrastructure by providing a framework to integrate data from disparate sources—event data; critical infrastructure data, such as hospitals, clinics, schools, and roads; pharmaceutical stockpile sites; political boundaries; and real-time data feeds, such as weather, traffic, and emergency room visits—then visualize, analyze, and map that information in order to create a common operational picture for communication and decision-making purposes." For more information, contact Jim Aspevig, public health informatics manager, Montana Department of Public Health and Human Services (e-mail: jaspevig@mt.gov). |