Spring 2006
Spring 2006 |
|||||||
|
|
|||||||
Hell's Canyon Complex Relicensing Project
Idaho Power Company Tracks Mule Deer Populations with GIS |
|||||||||
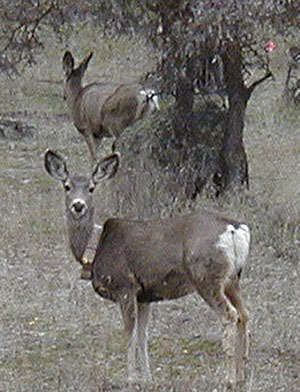
The sight of mule deer feeding along placid reservoirs creates a pastoral serenity that belies the name of the scenic paradise—Hell's Canyon. How did Hell's Canyon get its name? A gorge that plunges 7,800 feet (2,800 meters) to its lowest point, Hell's Canyon is one of the deepest gorges in North America. It is located along the Snake River, a natural boundary that runs between Idaho on the east and Washington and Oregon on the west. Some historians believe the name Hell's Canyon originated in 1895 when a cargo ship pilot named Haller made a trip down the Snake River rapids and called it Haller Canyon—later shortened to Hell's Canyon. Others believe the name may have been inspired by an expletive Mr. Haller used as he tried to pilot his boat in the raging whitewater. Whatever the circumstances, the name Hell's Canyon stuck. During the 1950s, the U.S. Department of the Interior planned to build a very high dam on the Snake River, which would have flooded Hell's Canyon and created a reservoir 93 miles long. It was part of a plan to supply hydroelectric power and irrigation throughout the Columbia River Basin. The Idaho Power Company, a private company, had a different plan to build three low dams and market the power commercially. The struggle between the government and the Idaho Power Company became a bitterly divisive national issue, pitting public power against private power. In the end, however, Idaho Power won the struggle and built its three dams on the Snake River: Brownlee, Oxbow, and Hell's Canyon. The three-dam Hell's Canyon Complex produces, on average, six million megawatt-hours of electricity each year—enough to supply approximately 460,000 households with power. The dams inundated a good part of Hell's Canyon, but below Hell's Canyon Dam (completed in October 1967) is a stretch of free-flowing (although regulated) river that still provides great recreation.
Idaho Power has been performing environmental analysis studies as part of its process to relicense the Hell's Canyon Complex with the Federal Energy Regulatory Commission. Included in the relicensing is a study of the area's mule deer population. Oregon and Idaho each has a large mule deer population. During winter, herds spend several months along the three-reservoir complex. Population estimates for the study area are between 10,000 and 15,000 deer. The study includes an assessment of how the deer interact with the reservoirs and how the reservoirs impact deer populations. ArcGIS Desktop software (ArcInfo and ArcView) was used extensively in this analysis. Trimble GPS units and Pathfinder Office software were used for data capture and postprocessing. As the study was planned, data dictionaries were formulated to contain GPS coordinates gathered with aerial telemetry and attributes about the mule deer's environment. Datasets included time of observation, deer behavior, characterization of the vegetation, and weather data. Between 1999 and 2001, a sample set of 255 deer was instrumented with radio collars, then tracked from aircraft to identify movement routes, habitats used, and causes of mortality. All telemetry data was downloaded from the GPS units into a GIS database, and maps were created in ArcView to check the data for accuracy prior to analysis. The GIS database was used to eventually manage thousands of GPS observations. During the study, Idaho Power's wildlife biologist Frank Edelmann worked closely with the relicensing project's GIS analysts, Chris Huck and Mike Butler. Edelmann explains, "We had a division of data responsibilities so that biologists could focus on being biologists, not GIS analysts. GIS is an analysis tool, not an end in itself. Huck and Butler focused on the spatial analyses and created map products that met our needs very well."
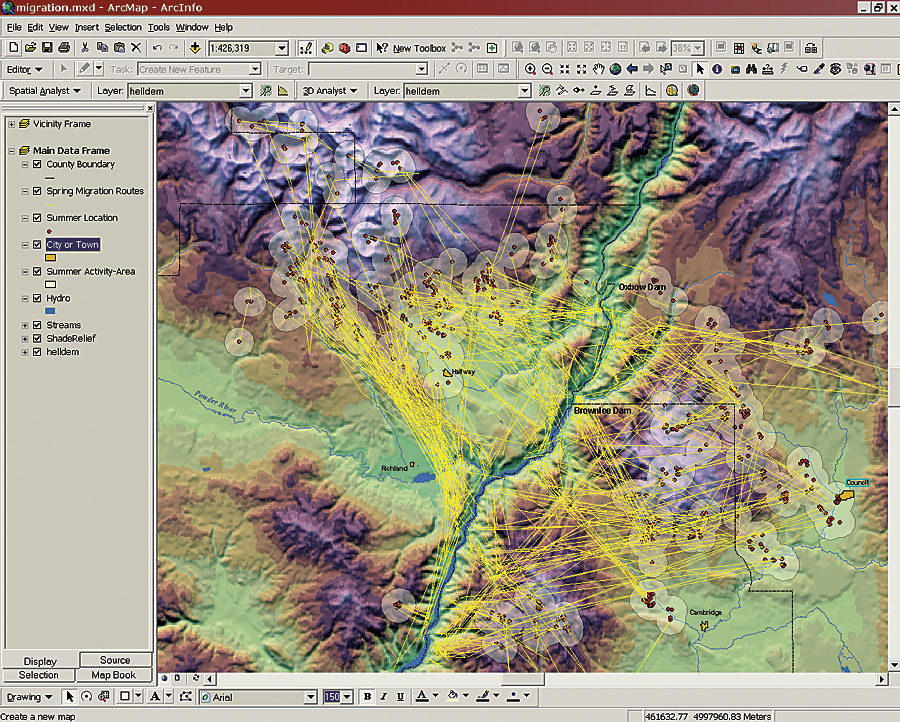
Nevertheless, the deer biologists learned much about GIS by the end of the study. Edelmann notes, "At the beginning of the project, I did not realize the magnitude of the spatial datasets and analyses that we would be using. It was important to have a standardized data management plan and QA/QC procedures in place from the study onset. This is important not only because of the data quantities but also because data management styles of individual researchers can vary, and this type of project can often have personnel turnover. Sometimes during data analysis sessions, we had to backtrack all the way to the GPS file to verify a deer's location. Having a systematic QA/QC procedure up-front can reduce data management problems later during analysis. It is also a good idea for biologists to take a few classes in GIS so they understand the terminology and concepts to communicate clearly with the GIS analysts and to get the map outputs desired." The GIS analysts worked with biologists in performing a variety of biological analyses using ArcView with the ArcGIS Spatial Analyst and ArcGIS 3D Analyst extensions. These maps clarified migration distances and identified migration routes. By overlaying individual deer movement patterns, the GIS helped biologists identify a migration corridor that was not previously understood. Sequential observations were linked, and the results indicated that deer habitually funneled through a relatively small area. The biologists considered factors influencing the migration corridor and concluded that this route enabled mule deer to largely avoid populated areas, including two towns.
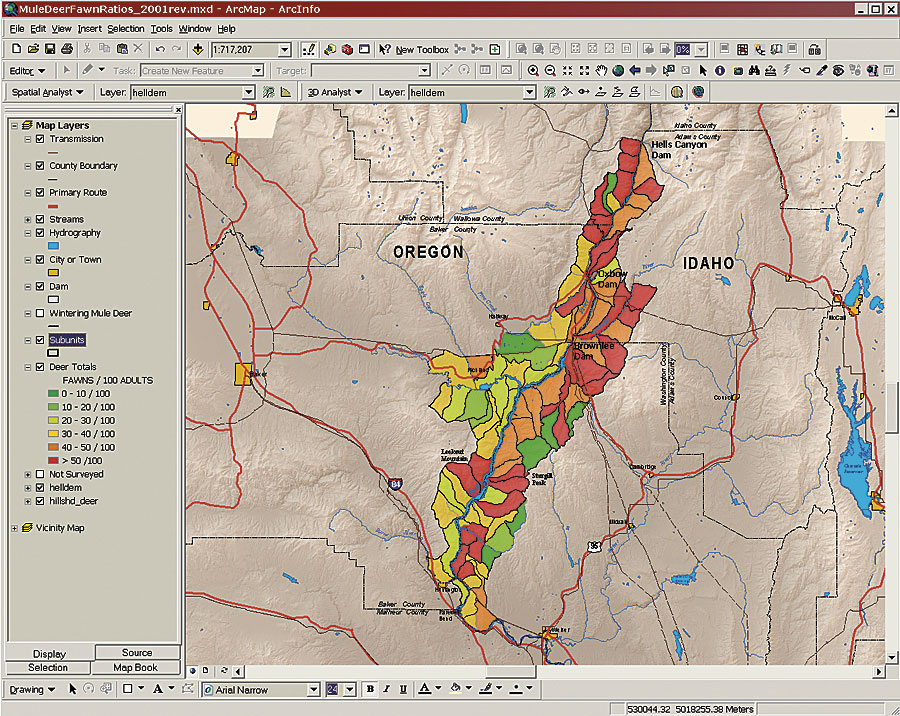
Idaho Power biologists also made use of geographic data produced by the Columbia Basin Ecosystem Management Project, Inside Idaho, Oregon Geospatial Enterprises, U.S. Department of Agriculture, and U.S. Geological Survey. Huck used ArcGIS 3D Analyst to conduct a number of surface analyses with this data. Says Edelmann, "The three-dimensional maps with shaded relief highlight the study's findings, making drainage systems and the migration corridor along the ridges stand out. GIS helped us communicate our findings so beautifully that we printed the maps in poster size." It became obvious that protecting the migration corridor is critical for the mule deer population. GIS maps made it easy to visualize that if someone were to create a barrier on that migration corridor, the mule deer would have additional difficulties accessing winter or summer range. It inspired Idaho Power to dedicate portions of its land to protect mule deer and the corridor as part of a wildlife management area. The company has also proposed to acquire additional lands to further protect this corridor and mitigate reservoir-related impacts to mule deer. For more information, contact Frank Edelmann, wildlife biologist, Idaho Power Company (tel.: 208-388-2355). (Special thanks to Idaho Power's Frank Edelmann for the information and Chris Ash for creating the GIS maps used in this article.) |