|
| |
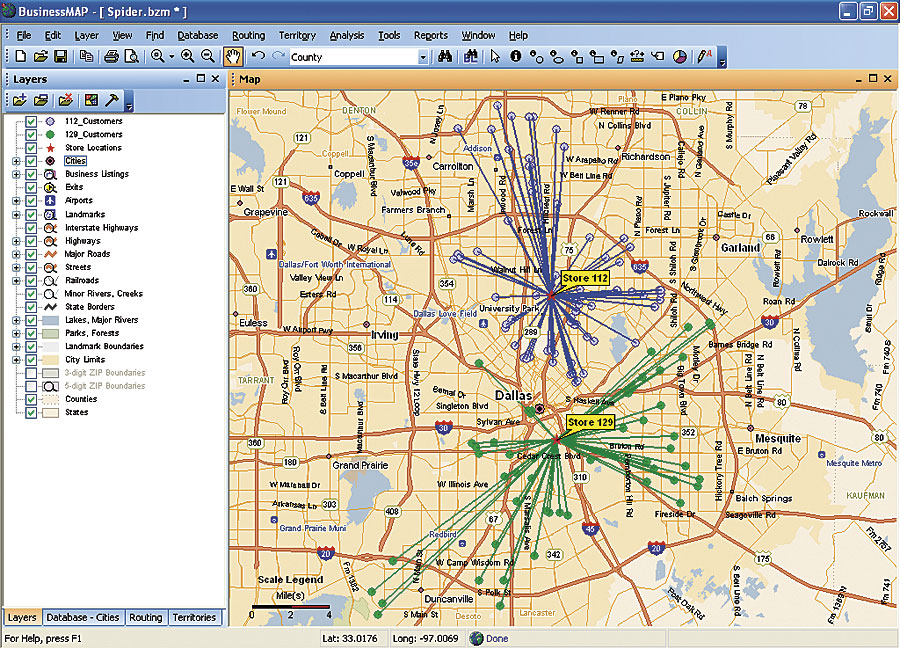
The Spider Diagram feature can reveal the relationships between customers and stores to aid in trade area and customer analyses. |
BusinessMAP 4.5, the latest version of Esri's database mapping software, provides new functionality, improved usability, and new and updated data packages. BusinessMAP 4.5 is an affordable combination of high-quality maps, updated comprehensive demographics and consumer expenditure data, easy-to-use visualization tools, and intuitive wizards.
Analysts in all industries use BusinessMAP for sales and marketing applications, such as territory design, drive-time analysis, ring studies, demographic analysis, customer prospecting, and trip planning. For example, users can easily convert static data into meaningful maps for a better understanding of customers, competitors, advertising, and other important factors to improve mission-critical business decision making.
| |
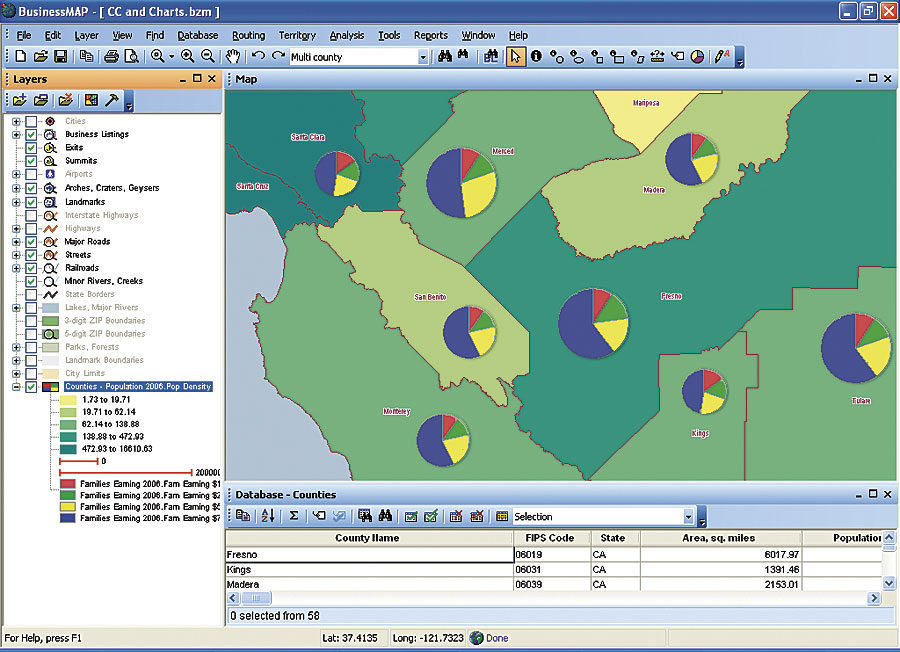
The On-Map Charting and Color Coding feature in BusinessMAP 4.5 enables users to perform visual analyses. |
In response to client feedback, new analysis tools in BusinessMAP 4.5 are designed to simplify the conversion of data into sophisticated maps so that organizations can clearly visualize business opportunities by area. These tools include
- On-Map Charting—The On-Map Charting feature provides a quick, effective way to reveal and analyze multiple demographic values. To more easily compare and emphasize values in selected areas, users can insert bar and pie charts into any map for selected areas, such as ZIP Codes, counties, or states.
- Spatial Calculator—This tool provides users with a simple method to build and balance territories by viewing data variables as they are added, subtracted, multiplied, or divided in the calculator display. It even allows the addition of database projections and estimates—for example, when creating and adjusting territories—and users also can include information about forecasted growth.
- Spider Diagram—This feature, also called desire lines, provides a simple way to visualize and highlight the differences between comparable datasets. To provide more comprehensive analytical illustrations, spider diagrams depict a many-to-one relationship that can quickly explain results. For example, spider diagrams can clearly illustrate the relationship between customers and the stores they patronize to determine if one store is pulling customers away from another store.
- Find Similar—The Find Similar tool enables users to find areas and select new markets with similar demographics within a larger selected area. Users can perform site analysis and target marketing applications, identify a geographic area with favorable demographics, and locate other areas with similar demographic compositions.
- Common Object Model Application Programming Interface—This feature enables programmers to customize and automate features in BusinessMAP. For example, programmers can now create customized BusinessMAP solutions that will solve unique user requirements.
BusinessMAP includes several examples of custom tools built with the API, such as Spider Diagram, Spatial Calculator, Find Similar, and the Label Manager toolbar. Users can also download Basic (BusinessMAP elements), Multi-Routing, Generate Lat/Longs, and Color Coding Wizard. As they become available, more examples will be listed for free downloading at www.esri.com/businessmaptools.
- New Geocoder—This new geocoder adds data to maps at the state, census tract, and block group geography levels in addition to appending street addresses, latitude-longitude, county data, FIPS codes, and 3- and 5-digit ZIP Codes.
- Label Manager Toolbar—Similar to those found in popular word processing programs, this floating toolbar simplifies changing the font type, size, and color of text labels on any map layer.
New or updated data in BusinessMAP 4.5 includes
- 2006 Demographic Data from Esri—More than 500 data variables of current-year demographic estimates and five-year projections at the state, county, ZIP Code, and census tract geography levels. Major data categories include population, population density, population by gender, age, race, gender, income, household, household earnings, family earnings, disposable household income, and net worth.
- 2006 Consumer Expenditure Data from Esri—More than 500 consumer expenditure variables for the automotive, insurance, financial, restaurant, retail spending, and medical industries are available at the state and county geography levels.
- Business Listings from D&B—Updated information about more than 22 million U.S. businesses can be searched by business name, location, type of business, or SIC code down to eight digits. Other D&B fields include business name, address, city, state, ZIP Code, telephone, latitude-longitude, and more. Users can plot search results on a map and view them in the BusinessMAP database browser. The ability to export the D&B data is available at an additional cost.
- Geographic Data—New data is now available from Esri Business Partner Tele Atlas/TomTom for geography levels such as states, counties, ZIP Codes, and census tracts.
- Street Data—New Tele Atlas/TomTom Dynamap Transportation enhanced street maps are available for the United States, Canada, and Puerto Rico.
- World Map Data—With ready-to-use mapping templates, Esri's world data is now part of the standard dataset in BusinessMAP. Compiled from public domain data, the world data includes ecologic regions, geologic provinces, satellite images, shaded relief, world template, and time zones. Smaller map features, such as country and administrative region boundaries, as well as cities, airports, mountains, minor rivers/creeks, lakes/seas, geologic provinces, and time zone boundaries, complete the geographic portion of this dataset. Attribute data, such as country population, area in square miles/kilometers, average life expectancy, gross domestic product (GDP), GDP growth rate, and exports/imports, is also included in this data package.
- Color Aerials—Colored aerial photos from i-cubed, LLC, can now be added to projects to more clearly view building footprints and other man-made features. Users can overlay additional map layers so that streets, parks, landmarks, and other image features can be labeled. A complimentary 30-day subscription to the color aerial photo service is available with the purchase of BusinessMAP.
- Updated Database Links—These links to the latest versions of ACT!, GoldMine, Outlook, and Excel enable users to plot database, group, or current contacts on a map and simplify direct linkage to BusinessMAP. Installing a link places an icon on the toolbar of these contact manager programs that will open BusinessMAP directly from the program. Users can then add a single contact, a group, or an entire contact database to a map in BusinessMAP. After contacts are mapped, users can perform applications such as geographic queries, get optimized driving directions, find nearby businesses, analyze demographics, create sales territories, generate reports, or use any of the other analysis tools in BusinessMAP to analyze a contact database. Geographic query results can be sent to the linked program as a group, category, or worksheet.
More Information
For more information on BusinessMAP 4.5 mapping software, visit www.esri.com/businessmap or call 1-800-970-0033.
|