Community Analyst Now Available
A Web-Based Solution for Planning and Policy Analysis
Highlights
- Generate instant reports and maps using thousands of data variables.
- Analyze data in any geographic context, including hand-drawn areas and imported shapefiles.
- Leverage the latest demographic, health, economic, education, and business data variables.
Following a successful beta program, Esri is in the process of releasing Esri Community Analyst. This online GIS solution is specifically designed for policy makers, government agencies, and civic organizations that have little or no technical GIS experience. Through the online data and mapping tools, users can quickly explore the geographic characteristics of any area and develop the right strategies for policies and resource allocation in their communities.
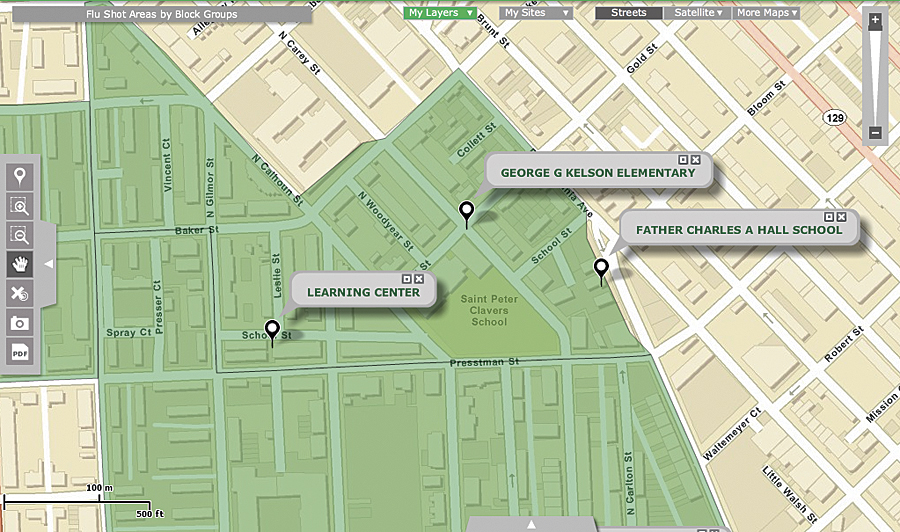
Find optimal locations for flu shot clinics in communities where there are large numbers of children in low-income areas.
Access to thousands of demographic, health, economic, education, and business data variables helps users discover patterns, relationships, and trends and analyze unique community characteristics for any geographic region, including hand-drawn areas. Reports and maps can be customized to a specific location and analyzed in a geographic context as granular as congressional districts, block groups, census tracts, or ZIP Codes.
Users can also visualize the data on a thematic map or aerial imagery and view changes immediately on an interactive map as parameters are adjusted. Customized drive times or rings can be selected to allow users to learn more about the types of people who live in a particular location. For example, the Tapestry Segmentation Profile report reveals the neighborhood types that live in each area, including demographic and socioeconomic characteristics and preferences, such as Internet usage, types of radio programs listened to, and hours of daytime TV viewed. This type of detailed information can be helpful in determining how to best reach individuals living in these areas. For easy collaboration and information sharing, users can also generate and e-mail print-ready reports and maps in PDF or Excel format to other stakeholders.
Community Analyst can help answer the following:
- How should resources be allocated to have the greatest impact?
- How can allocation decisions be communicated to the public?
- What types of people will be impacted by a policy decision?
- What are the demographic trends that will affect a particular area?
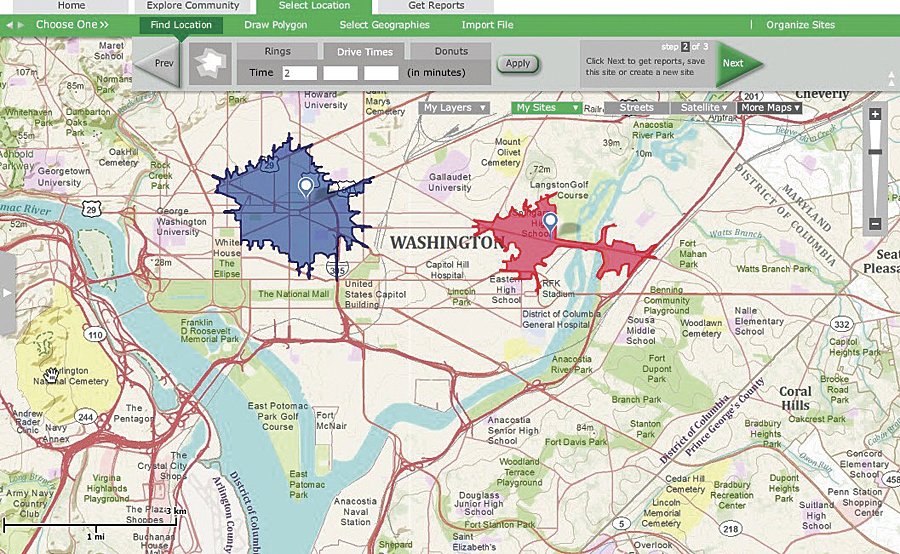
With a topo map as a background, users can view separate drive times in Washington, D.C.
Many users can benefit from Community Analyst. For example, health care professionals who need to provide subsidized flu vaccines to low-income households can use Community Analyst to determine the best location for a flu shot clinic to serve the greatest community need. Using the Smart Map Search feature, users can select up to five customizable criteria and easily see all the areas on an interactive map that meet these criteria. The user can search for areas with low household income, a large population of young children, and limited access to public transportation to then make an informed decision about where to place the clinic.
Public officials forced to make difficult decisions regarding infrastructure funding can compare areas side-by-side using detailed employment, age, income, and education variables, including five-year population predictions. Projects can then be ranked in terms of highest priority based on the overall community impact. This information can be made available to constituents for greater transparency and an improved decision-making process that can be understood by the public.
For more information, visit esri.com/communityanalyst.