Summer 2008
Summer 2008 |
|||||||
|
|
|||||||
Shelby, North Carolina, Uses Geoanalysis and Visual Reporting as Part of Its CrimeStat Processes
Intelligence-Led Policing Gives a Crime-Fighting Advantage |
|||||||
Highlights
In modern policing, the process of computer statistics (CompStat) has revolutionized how law enforcement can more effectively fight crime. The use of sophisticated crime data analysis, reporting, and geography-based accountability has swiftly been embraced as a common practice throughout the nation's many thousands of police agencies.
For the Shelby, North Carolina, Police Department, CompStat is not only accurately painting a picture of what is happening, it is also providing concrete information to act on and has helped reduce crime significantly. Map-based tools have helped the department see exactly where crimes have been reported and respond with effective deployment of staff. The result is a dramatic decrease in incidents reported. Says Jeff Ledford, captain, Shelby Police Department. "We're constantly looking for new and improved methods to reduce crime and make our community one of the safest cities in North Carolina. GIS technology is definitely helping us get there." The city of Shelby is a community of approximately 21,000 residents and covers an area of about 19 square miles. Its police department is a full-service agency composed of 86 full-time employees. The department handled more than 46,000 calls for service in 2006. Operating under a community-based policing philosophy, the agency uses an enterprise GIS approach for mining its criminal records and incident data to proactively fight crime and collaborate with its community. Shelby police officers were introduced to the power of computer mapping by visiting other, larger agencies deploying the technology. "We researched how other departments look at crime patterns and distribute information to staff," explains Ledford. "We had help from departments such as those from D.C. Metro; Baltimore, Maryland; and New Orleans, Louisiana, as well as some local agencies similar to us in size. We looked at the different ways people are plotting crime trends, and we evolved our program from that. We call our program CrimeStat, after the model used in New York. But it's not a cookie-cutter program. You can't take exactly what a larger agency does and fit it to yours. So we built and customized it to fit Shelby." According to Ledford, a catalyst in the use of GIS for the department was Chris Martin, Shelby's GIS manager. Martin joined the city in 2006 and quickly went around to various departments to discuss how GIS could improve business tasks.
"He approached me about GIS applications that would not only map out and track crimes that were entered into our records management system but also generate reports that could be disseminated to our staff," says Ledford. After collaborating with other agencies to get feedback on their GIS experience and technology, Shelby police officers came away impressed. They soon implemented Crime Analysis Tools (CAT), an ArcGIS extension that analyzes crime patterns and calls for service. Developed by Esri Business Partner Bradshaw Consulting Services, Inc. (BCS) of Aiken, South Carolina, CAT uses a highly intuitive, law enforcement-focused interface to assess crime, predict future incidents, and create a common operating picture for optimized decision support. CAT allows law enforcement agencies to view and analyze incidents by crime type on a weekly, monthly, and annual basis and helps comb through volumes of data stored in record management systems to pinpoint and respond to all types of crime, such as homicide, sexual assault, robbery, larceny, and car theft. The query results, once visualized on a map, can then be shared agency-wide. "Police officers need to know the pertinent information, they need it fast, and they need it to be easily understandable," says Ledford. "We look at crime trends [using CAT] and once we see something, we help department managers work with their officers and use these reports to make sure all our resources are going to where they're needed, to where the calls are. We get the trends, we see them as they're emerging, and we then respond accordingly. We can see where incidents are happening and where we need to focus our resources." Every month, Ledford and the department's service division manager, Terry Grayson, generate crime reports and presentations using ArcGIS tools that access their records management system (RMS) data and information from other sources. Their findings are then presented and reviewed in a monthly CrimeStat meeting.
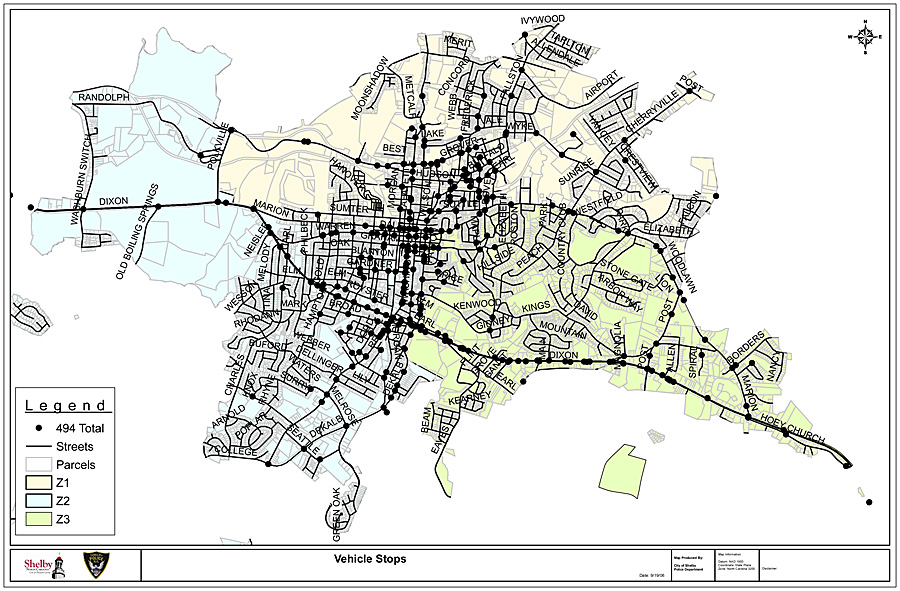
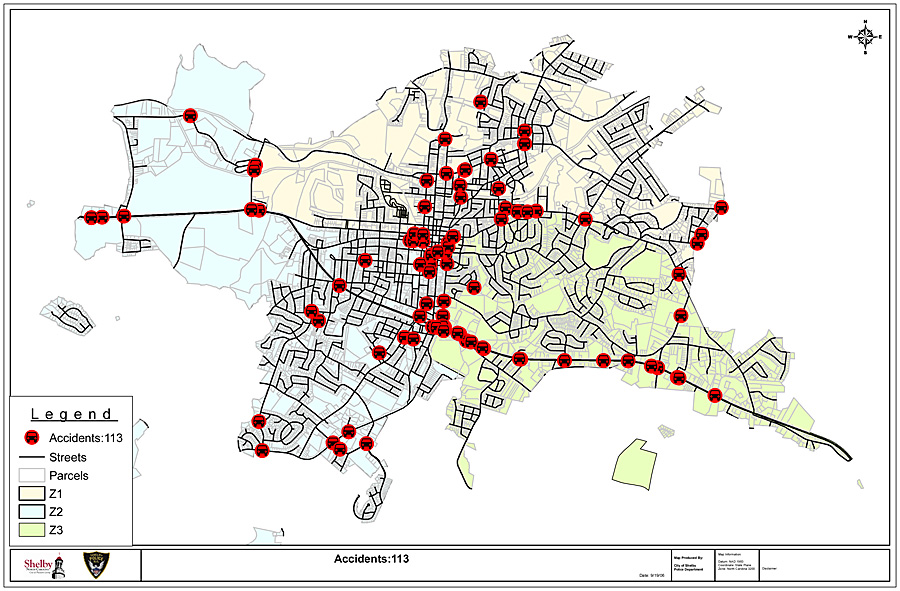
At these meetings, GIS-based maps are used to provide staff members with the statistics and crime patterns from the previous month. Each crime category is then discussed, and strategies are put in place to reduce the number of crimes being committed. The meetings help staff see the ever- changing nature of crimes, as well as the crime trends taking place in the city. The CrimeStat meetings are also open to the public and help in the collaboration between law enforcement and the community. In addition to monthly meetings, the department has regular six-month and end-of-year assessment meetings. There are a number of ways the department can use GIS to "slice and dice" data. For instance, the department can look at district breakdowns of incidents reported, repeat calls, and areas where particular crimes have spiked above average. These analyses can then help department leaders compare and contrast data in other districts. The department can also build GIS maps that show the link between the locations of stolen vehicles and where they are recovered. Crime density maps can show areas where a particular crime is especially high, such as stolen property or driving under the influence. The agency also tracks car accidents, patrolling high-risk crash zones where more officers can be placed for selective enforcement. "We also track vehicle stops, and what we want to look at is, are we stopping enough cars and are we saturating those areas where we're seeing high crime?" says Ledford. "It's a perfect overlay. We look at where our more serious offenses are taking place and whether there are enough officers making stops in the areas where crime is highest." For future applications, the Shelby Police Department is looking at training sergeants and other staff members on using GIS tools to produce their own customized maps that they can use in the field on a daily basis. "The key to success when you're using any type of crime trend analysis or crime data analysis is to get that information in real time to the front-line troops," explains Ledford. "That's how we're evolving our process now. We want to more efficiently get that front-line officer, who is getting ready to hit the street, real-time information. We're looking to train field sergeants on using the software directly so they can go in and analyze a type of crime or series of crimes by day or week or month, whatever they want." More InformationFor more information, contact Captain Jeff Ledford (tel.: 704-484-7167, e-mail: jeff ledford@cityofshelby.com). |