Tidal Stream Power Potential Assessed
Highlights
- ArcGIS helps define the most suitable locations for tidal stream power conversion.
- GIS-based analysis incorporates physical, environmental, and socioeconomic aspects to select optimum locations.
- A proof of concept was demonstrated for the state of Georgia.
Tidal streams are sea currents created by periodic horizontal movement of the tides, often magnified by the shape of the seabed, where water is forced to flow through narrow channels or around headlands. Tidal stream energy extraction is derived from the kinetic energy of the flow, analogous to the way a wind turbine operates in air.
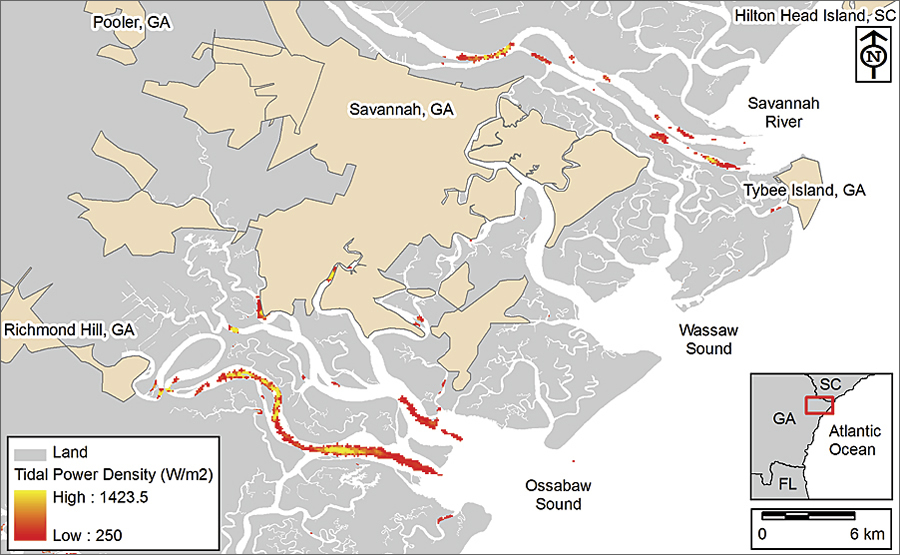
Tidal stream power density filtered by a minimum value.
Supported by Congress through the Energy Policy Act of 2005 and the Energy Independence and Security Act of 2007, the Wind and Hydropower Technologies Program within the Office of Energy Efficiency and Renewable Energy in the US Department of Energy (DOE) substantiates an accelerated deployment of wind and water power technologies with improved performance and lower costs. Water power goals of the program involve understanding the potential of advanced marine hydrokinetic technologies for energy generation from ocean currents and tides. A variety of conversion devices are currently being proposed or are under active development, from a water turbine similar to a scaled wind turbine driving a generator via a gearbox to an oscillating hydrofoil that drives a hydraulic generator. Tidal energy is one of the emerging technologies in the renewable sector and is set to make a contribution to carbon-free energy generation. But the first step in assessing the power potential involves mapping the existing kinetic energy of the tidal currents.
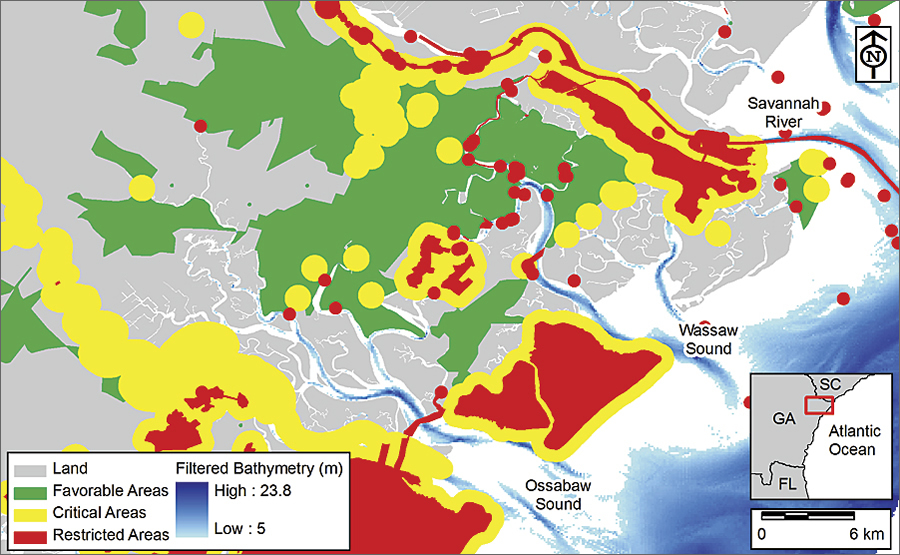
Exclusive (red), critical (yellow), and favorable (green) areas for tidal stream power conversion were established. Bathymetry was filtered by a minimum depth.
As part of these goals, in a study funded primarily by DOE, the National Science Foundation, and the State of Georgia, researchers from the Georgia Institute of Technology assessed the tidal stream power potential along Georgia's coastline, defining the most suitable locations for possible power conversion projects. As outlined in its recent publication in the Journal of Renewable and Sustainable Energy Reviews, the team used an extensive set of GIS data from major sources that include National Oceanic and Atmospheric Administration Electronic Navigational Charts; National Geophysical Data Center and Environmental Sensitivity Index maps; and the United States Geological Survey, United States Census Bureau, and Environmental Protection Agency. State and local environmental information was also accessed at the Georgia Department of Natural Resources and US Fish and Wildlife Service. They categorized the geospatial data gathered from these sources into three main conceptual layers: the physical realization layer, the environmental constraints layer, and the socioeconomic constraints layer. These layers include information on the basic geometry and physics of the problem that sets the physical boundaries; areas that are of environmental concern, such as habitats of endangered species; and regions of social and economic concern, which involve restricted areas (e.g., shipping lanes) or favorable locations (e.g., developed areas).
Through an Esri university site license agreement, the team used ArcGIS extensively to analyze the data in these layers to identify suitable locations. A set of parameters that are necessary to evaluate the suitability and classify the favorability of a site for power conversion was established based on site selection practices from other marine renewables, hydropower systems, and wind energy projects. Data from different sources was merged into separate themes with the help of ArcGIS; the favorable and restricted areas were defined by merging the related features, the environmentally sensitive areas were marked as critical and were quantified, and the raster data for depth and tidal power density were spatially filtered for minimum values using the ArcGIS Spatial Analyst extension. The maps were masked to exclude the restricted areas, and the distances to transportation and transmission lines and favorable areas were computed using the Spatial Analyst toolbox. The final results were obtained after calculating the power density, accessibility, and environmental scores by overlaying these values on the masked maps in ArcGIS.
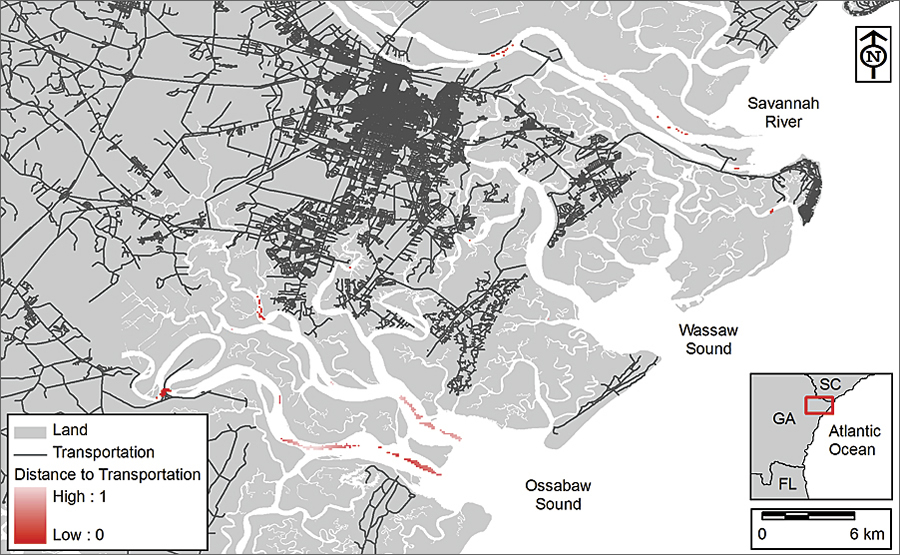
Normalized distance to transportation lines from the suitable locations for tidal stream power conversion was defined.
"The GIS portals that serve as public gateways to data sources, such as Geodata.gov for countrywide geographic data, were very helpful in accessing the data," says Zafer Defne, the postdoctoral research fellow who implemented the decision support system. Coastal zones are very complex systems of dynamic nature where human activities, sensitive biological fauna, and changing physics overlap. Implementing a methodology for selecting suitable sites for tidal power conversion was only possible by using the available geospatial data and relevant GIS tools.
For more information, contact Zafer Defne, Georgia Institute of Technology (e-mail: zafer.defne@gatech.edu).