Winter 2005/2006
Winter 2005/2006 |
|||||||
|
|
|||||||
The Subsurface Geology of Brussels, Belgium, Is Modeled with 3D GIS |
|||||||
|
By X. Devleeschouwer and F. Pouriel
From an administrative point of view, a single area with a surface of 162 km2 for the 19 communes of Brussels, Belgium, was established in July 1971. This was known as the "Agglomeration" of Brussels and had authority in the areas of town and country planning, transport, safety, public health and cleanliness, economic expansion, etc. Since June 18, 1989, the Brussels-Capital Region has been an autonomous region comparable to the Flemish and Walloon regions. Urban development and the restoration of many buildings are two main processes related to the urban evolution (growth of the population and evolution of the frame) in the Brussels area. The Brussels population was approximately 20,000 people during the 14th century. In the majority of large European cities, it was only during the 19th century that the population increase intensified, growing to exceed one million inhabitants in 2004. Brussels developed by space diffusion starting from the medieval city center and suburban small villages included today in the Brussels-Capital Region. Urban growth was fast between 1955 and 1985, reaching 600 hectares/year on average and decreasing gradually since then (100 hectares/year between 1985 and 1997). The town of Brussels is divided into various sectors. An average and easy population migrates to the periphery of the city (e.g., close to the Soignes Forest), forsaking many old quarters (along the axis of the Senne valley) occupied today by an underprivileged population. The restoration of these quarters and the continuous urban development require an important investment. Thus, to manage and facilitate the realization of such work, a thorough knowledge of the underground is essential.
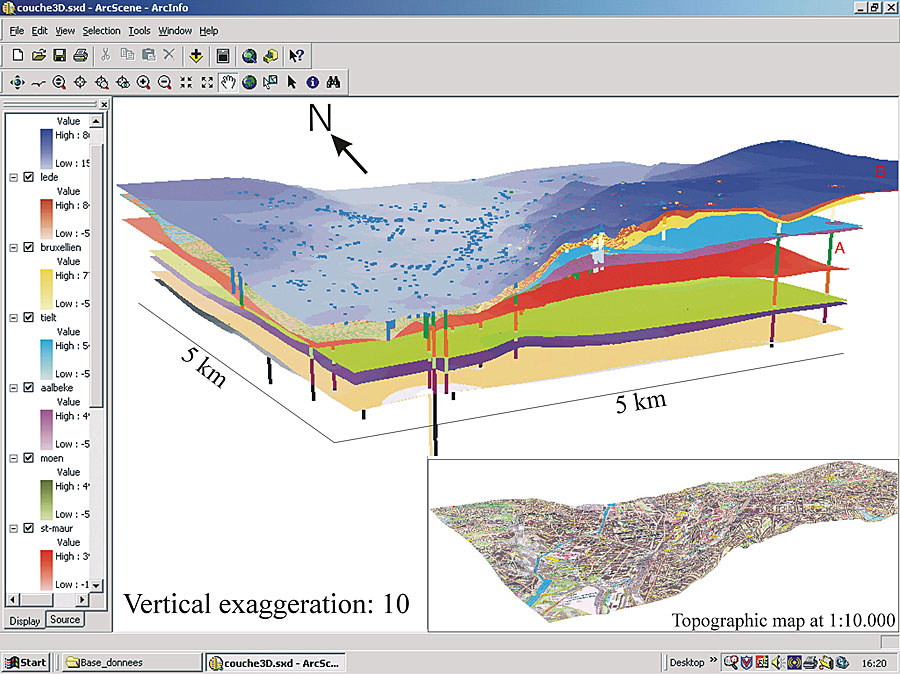
Two years ago, the Geological Survey of Belgium (GSB), located in Brussels, launched a new GIS program called Brussels Urban Geology (BUG), centered on the urban geology of the European capital. The main objective was to build 2D and 3D GIS models of the Brussels subsurface geology. As a result, the GSB team created an application with ArcGIS Desktop (ArcView) software with which all the available data gathered could be stored in a database and managed within an open, dynamic, and visual GIS. ArcView was chosen essentially for the ArcGIS 3D Analyst extension accompanying the main software. Technically, this GIS application is based on the creation of two complementary modules: a relational database management system using Microsoft Access 2000 software for the descriptive data and a cartographic management system using ArcView software for the raster and vector geographic data. The raster images used most often are topographic and geological maps. The oldest geological maps (1:20,000 scale), covering the Brussels area for the first time, were created at the end of the 19th century. Other raster images, such as digital orthophotos and digital elevation models of Brussels from the National Geographic Institute, are also often used. Many vector layers, based essentially on several geological aspects, have been developed, such as the encountered geological formations, drill holes, underground workings, outcrops, and fossiliferous sites. Other layers bring some information on the fluvial network of the Senne River and the old fortifications of Brussels. The database and ArcView software are connected through a geodatabase that avoids double data acquisition and facilitates the management of new information. The drill holes, constituting the background data and starting point of the program, were stored and managed in the same main database. The gathered data came essentially from two distinguished sources: the archives of the GSB constituted by all the geological information (drill holes, wells, outcrops, etc.) gathered by the geologists since 1896 (the creation date of the GSB) and the archives of the Ministry for the Equipment and the Transport of the Walloon Region corresponding to drill holes carried out during major building projects (motorways, subways, industrial sites, etc.) since the 1950s. The 3D model was developed through the drill holes database. Drill holes, using ArcGIS 3D Analyst, are represented in the form of a column shape or stick of various colors. Each color corresponds to a different geological formation. The length of the stick is proportional to the estimated thickness of the geological formation. Once the 3D representation of the drill holes is done, modeling of the roof for each geological layer is carried out with the inverse distance weighted (IDW) interpolation method using the ArcGIS 3D Analyst extension.
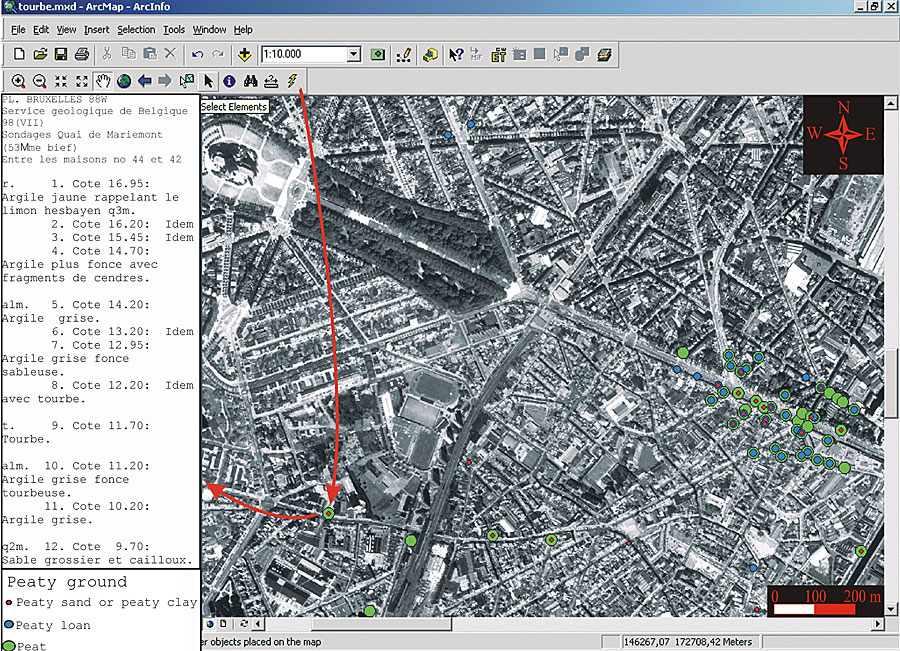
Two other databases have been created in the BUG program. One of them concerns the peat layers observed in the drill holes. The description in the database indicates the type and nature (with sand, clay, etc.), thickness, and depth of the peat layer. The main objective is to identify cartographically the zones where the presence of peat layers has involved some small ground movements (subsidence) due to water level lowering. The other one corresponds to the cartography of the backfill thicknesses observed in the drill holes. The IDW interpolation method allows creating an isopach map of the backfills. ConclusionThe impact of human activities leads to a situation in which the subsurface geology of the cities constitutes, at the same time, both a heritage to protect and a risk to prevent. Thus, knowledge of the underground constitutes an essential base to take into account these aspects. This knowledge requires a geometrical modeling of the geological layers and an estimation of the position and thickness of the various geological formations that are known essentially by exploratory work (drill holes) carried out at large building sites. The density of this geological information, as its quality, is highly variable throughout the city. In the future, collecting other data from cone penetration tests or new data from other sources will help to understand and improve the model of Brussels' subsurface geology. An application of the 3D modeling allows deciphering of the seismic response in case of a major earthquake. This is the idea of a program launched by the Royal Observatory of Belgium that aims to provide authorities with predictive maps in an urban and densely populated city, such as Brussels. For more information, contact Dr. Xavier Devleeschouwer, geologist of the Geological Survey of Belgium, Royal Belgian Institute of Natural Sciences (e-mail: Xavier.Devleeschouwer@naturalsciences.be, tel.: 32-2-788-76-38). |