Winter 2009/2010
Winter 2009/2010 |
|||||||
|
|
|||||||
Custom Web GIS Functionality Facilitates Data Exchange
Monitoring the Albertine Rift in Africa |
|||||
|
By Jared Stabach, Aggrey Rwetsiba, Dan Deneau, Greg Fiske, Wayne Walker, and Nadine Laporte Highlights
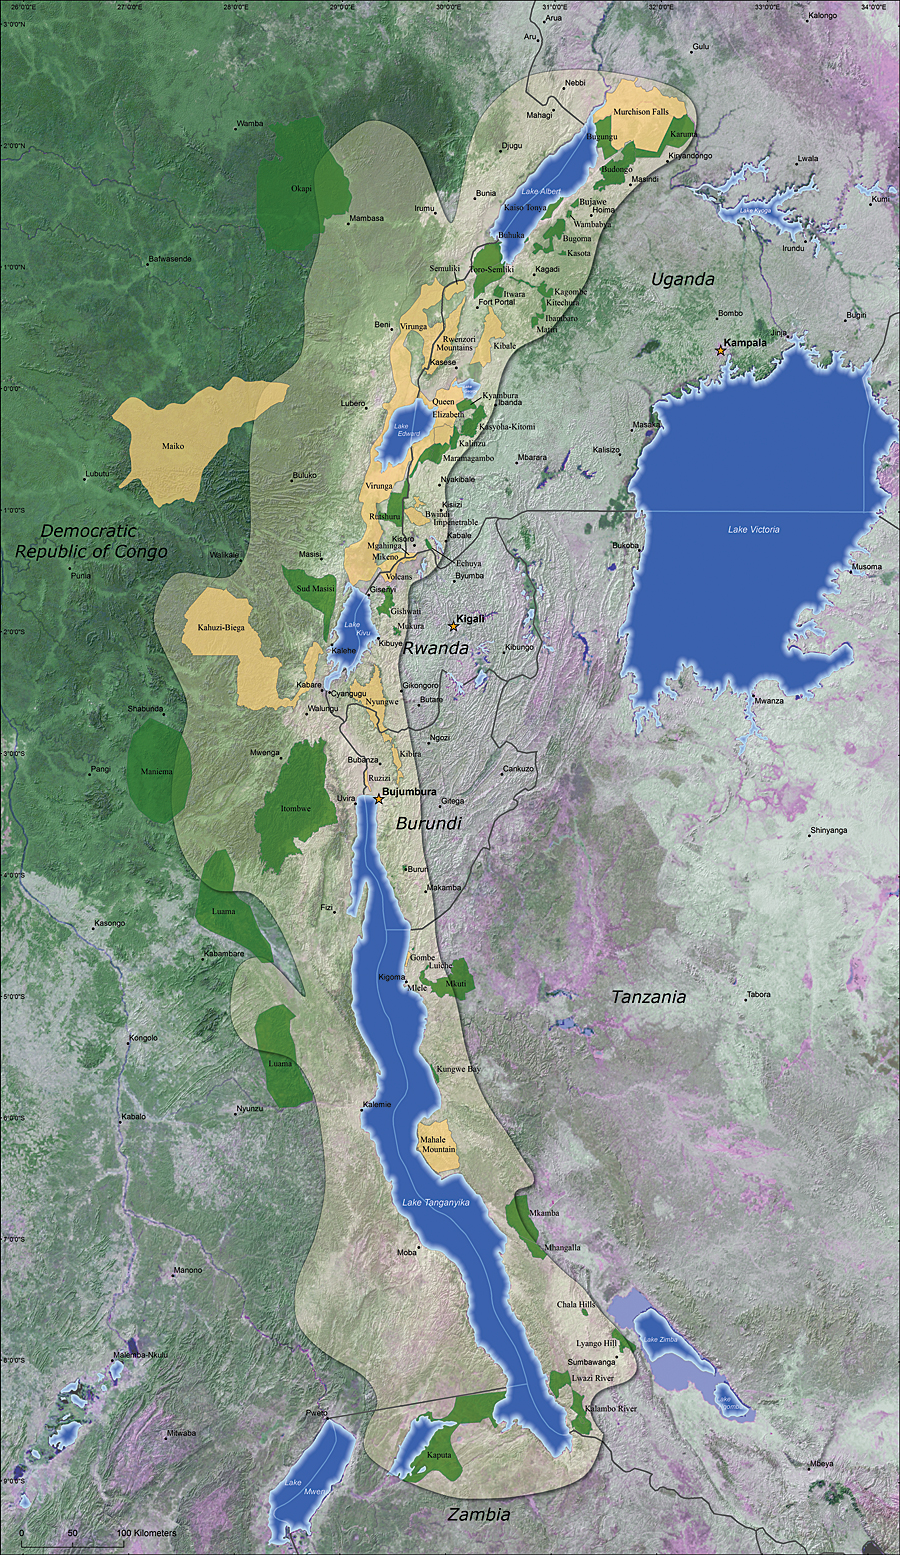
Stretching from the northern end of Lake Albert to the southern end of Lake Tanganyika and spanning portions of Uganda, Rwanda, the Democratic Republic of Congo, Burundi, and Tanzania, the Albertine Rift is one of Africa's most important—and most threatened—sites for the conservation of biodiversity. Formed over the course of millions of years, the Albertine Rift is the result of two tectonic plates that collided and are now slowly pulling apart. This geologic activity has created some of the continent's tallest mountains and a number of the world's deepest lakes and contributed to the diversity of habitats that include active glaciers, alpine grasslands, volcanoes, lowland and montane forests, and various grass and woodland savannas.
Since the early 1990s, however, this hot spot of biodiversity (home to more than 7,500 species of endemic plants and animals) has been plagued by a series of devastating conflicts, resulting in more than 3 million deaths and the displacement of approximately 2.7 million people. The region is one of the most populous in Africa, with up to 300 people per square kilometer in some locations. In addition to the pressures of population density, an influx of refugees and the lack of settlement policies have compounded the problem of forest degradation, fragmentation, and loss—particularly in protected areas. The Need for Remote SensingThree years ago, the Woods Hole Research Center (WHRC) of Falmouth, Massachusetts, began working in the region to promote the development and use of remote sensing as a tool for conservation, with the principal goal to better facilitate the exchange of information between collaborative members of the conservation communities, such as the Wildlife Conservation Society (WCS) and the Uganda Wildlife Authority (UWA). WHRC activities have included the integration of remote-sensing analysis into existing decision support systems (such as the Uganda Management Information System); the production of basemaps of land use/land cover, deforestation, and fire extent; and the development of monitoring tools that combine remote-sensing and biodiversity data. The acquisition and exchange of this important conservation data, in turn, are intended to improve natural resource management, distribute spatial information to support conservation policy analysis, encourage a dialog across a broad user community, and provide technical training to support the long-term use of spatial data and analysis tools. Building a Web InterfaceTo better accomplish these goals, WHRC identified the need to provide data via a Web interface. While standard off-the-shelf Web GIS applications can easily be implemented, their generic interfaces lacked tools that were necessary to interact with both nontechnical and more technically inclined users (e.g., inability to access metadata information or to query raster datasets). Thus, WHRC teamed with the Institute for the Application of Geospatial Technology (IAGT) of Auburn, New York, which had experience building mapping applications, to develop a customized Web GIS application. IAGT selected ArcGIS Server for the development of the Web GIS because the institute could take advantage of Esri's ArcObjects. The ArcGIS Server platform allows users to do more than merely display and navigate the map. As users interact with the mapping application, ArcGIS Server runs geoprocessing routines on the fly, such as extracting shapefiles and converting features to graphics (and vice versa). Several custom tools were created to make the custom Web GIS application a more interactive and useful tool.
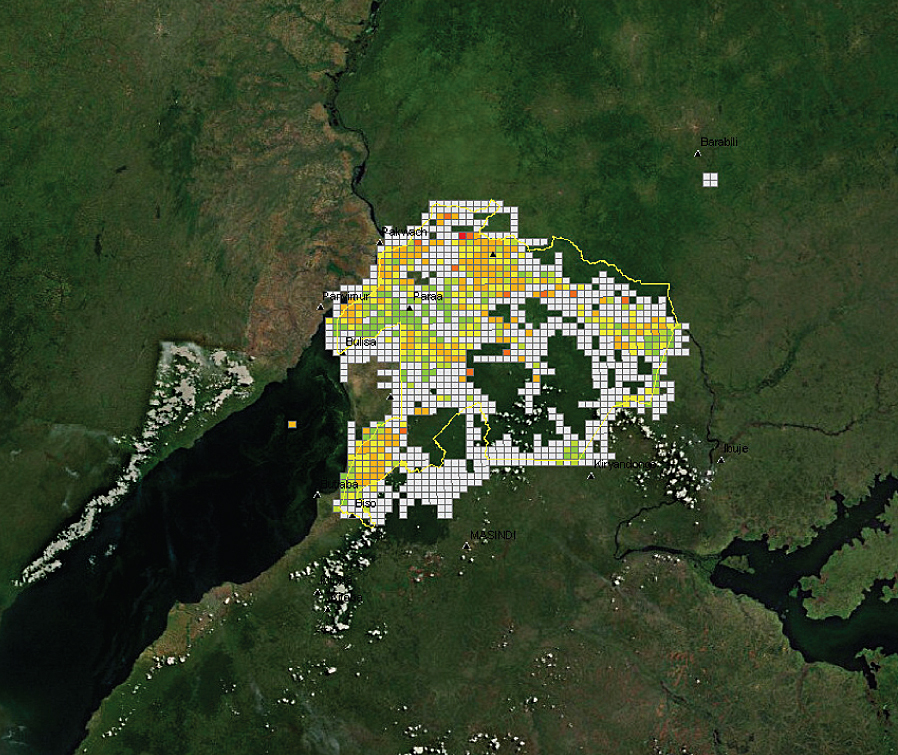
Data for five protected areas throughout Uganda (Budongo/Bugoma Forest Reserve, Kibale National Park, Murchison Falls Conservation Area, Queen Elizabeth National Park, and Semuliki National Park) is currently available within one access point. The data displayed is a culmination of various remote-sensing-derived products (e.g., land cover, base imagery) and vector information that was collected by UWA rangers. These vector layers include general spatial information related to each of the protected areas (e.g., protected area boundaries, rivers, roads), information related to the threats throughout the park (e.g., encroachment, poaching), and wildlife sightings that have been collected during UWA ranger patrols (1985�present, depending on the protected area). About the AuthorsAggrey Rwetsiba is the Uganda Wildlife Authority monitoring officer; Nadine Laporte is the PI of the Albertine project; and Jared Stabach, Greg Fiske, and Wayne Walker developed the GIS layers at the Woods Hole Research Center in Falmouth, Massachusetts. Dan Deneau is a software engineer for the Institute for the Application of Geospatial Technology at Cayuga Community College in Auburn, New York. IAGT specializes in geospatial application development and data processing. More InformationFor more information, contact Nadine Laporte, Africa Program, Woods Hole Research Center (e-mail: nlaporte@whrc.org) or visit http://www.whrc.org/mapping/pawar/index.html. This work is funded by the NASA Application Program—Ecological Forecasting—Biodiversity, with additional funds from the National Science Foundation Human and Social Dynamics program. |