Contiguous Coastal Mapping Provides Critical Marine Information
The Pacific Northwest ShoreZone Project Maps 100,000 Kilometers with GIS
Highlights
- Datasets and imagery are essential for resource planning.
- In Alaska, approximately 47,000 kilometers of shoreline are mapped or being mapped.
- As various pieces of the shoreline are connected, increased opportunities to develop regional models emerge.
Coastal and Ocean Resources Inc. (CORI), based in Sidney, British Columbia, Canada, has been supplying professional consulting services to the geologic and environmental sciences industry since 1987. Its focus is the marine environment from the coastline to the deep sea. Of the many projects this group has undertaken, one of the most significant is the ShoreZone coastal habitat mapping program, which has been widely used in the Pacific Northwest over the past 20 years.
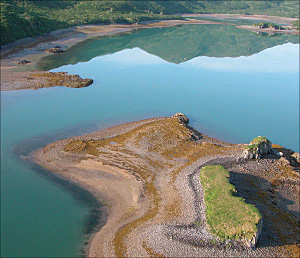
The dark band at the water's edge is an eelgrass bed that can be classified and mapped and becomes part of the 47,000-kilometer Alaska ShoreZone dataset.
The program is a coastal habitat mapping and classification system in which low-altitude georeferenced aerial imagery is collected specifically for the interpretation and integration of geologic and biologic features of the intertidal zone and nearshore environment. The system's datasets and imagery provide a critical backbone for a variety of applications and uses, from resource monitoring, planning, protection, and consumption to hazard mitigation and policy formation. The ShoreZone coastal mapping program has involved a wide-ranging partnership of scientists, GIS specialists, Web specialists, nonprofit organizations, and governmental agencies. CORI has executed most of the field programs, including information management, data processing, and product deliveries, with project partner Archipelago Marine Research Ltd., based in Victoria, British Columbia, Canada.
The project was originally developed in the early 1980s by the Province of British Columbia as a physical habitat mapping system that was applied primarily as an oil spill response tool. Since then, the entire coast of Washington (~5,000 km) and British Columbia (~38,000 km) has been mapped, and an aggressive inventory program is under way in Alaska with approximately 47,000 kilometers of shoreline mapped or being mapped.
In the 1980s, ShoreZone consisted of paper maps and associated tables. To enhance efficiency, by the mid-1990s, the Washington and British Columbia inventories were converted into GIS data using ArcView. CORI has since continued to move forward with Esri technology to take advantage of new developments in ArcGIS Desktop and ArcGIS Server technology. Since it started using GIS, CORI has been able to map approximately 10 times the amount of coast that it was able to process before.
"The move to GIS enabled us to capture and manipulate many times the amount of data that we were able to previously and has made the process of data maintenance, analysis, and sharing more efficient and accurate," says John Harper, marine geologist and CORI president.
Before moving to GIS, CORI's database of choice was inherently detached from the maps, so linkages were vulnerable. Now, incorrect linkages are immediately flagged, which saves many hours that were previously devoted to data proofing while dramatically improving data accuracy. The classification and mapping system is based on oblique aerial video imagery and still photography of the shoreline that is georeferenced, time synchronized, and collected specifically for the project. At the time of capture, this imagery is accompanied by continuous, simultaneous commentary by a geologist and biologist aboard the aircraft that is later used to assist with the vector data creation and mapping of the shoreline. Imagery is targeted for low tide during the lowest tides of the year so that most of the intertidal zone is exposed when the imagery surveys are performed. By capturing imagery at extremely low tides, CORI is able to map substantially more shoreline information.
The imagery is interpreted initially by geomorphologists who segment the shoreline into discrete units of homogenous morphology (form and substrate type) and exposure. The units are digitized in ArcView and the physical attributes recorded in the geodatabase. Then the dataset is passed to biologists who interpret and record observed biota (such as intertidal organisms, subtidal algae, and some subtidal fauna) for each shore unit.
Once the data capture process is complete, program partners (often government and not-for-profit organizations) use this data internally, and some post it to their online sites. ShoreZone data provides a spatial framework for coastal and nearshore habitat assessment on local and regional scales. Individual resources, such as eelgrass occurrence in Prince William Sound, can be displayed and plotted, or combinations of resources with multiple attributes can be displayed together to reveal new information, patterns, and trends. For example, substrate type and wave exposure levels are used to predict shorelines sensitive to oil spill retention.
"The dataset is being used in all sorts of applications that we never anticipated," says Harper. "Recreational users find the online imagery especially useful in trip planning for kayak expeditions, fishery managers use it to identify shore-zone attributes of high-value spawn sites, and oil spill contingency planners are able to identify accessibility of the shore to alternative types of response equipment."
These applications are critical to support the efforts of online site visitors focused on ecological sustainability, environmental hazard mitigation, and public use of these areas for recreation and education. The dataset is particularly useful for regional marine planning programs such as The Nature Conservancy's (TNC) Bering to Baja marine conservation initiative, where sensitive or rare habitats are identified. TNC can identify these habitats and add their locations to its land acquisition strategy.
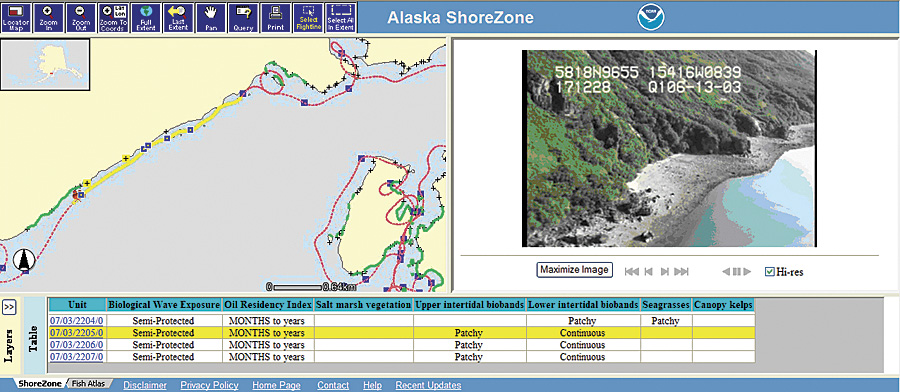
The Alaska ShoreZone Web site is hosted by NOAA. The left panel shows the aerial flight track and locations of still photographs; also shown is shoreline with eelgrass (highlighted in green). The right panel shows the image player, allowing the user to "fly" the shoreline.
Using GIS, CORI is also able to create a standardized digital shoreline so that its data integrates seamlessly with clients' thematic data. Because clients are quoted a unit mapping price per kilometer of mapped shoreline, a standardized digital shoreline is essential to quickly determine costs. GIS enables the client to immediately see the extent of shoreline to be mapped for its planned level of expenditure.
"ShoreZone has been a great tool for making the Alaska coast more accessible," says Sue Saupe, science director of the Cook Inlet Regional Citizens Advisory Council and original proponent of ShoreZone in Alaska. "By making the imagery and data Web accessible, the project has attracted many nontraditional users that don't have access to GIS, while sophisticated GIS users appreciate the richness of the dataset that now extends along thousands of kilometers of shoreline."
This dataset provides a framework that underlies detailed site-specific research and supplies a tool for tying together a wide range of nearshore studies. Ultimately, the Alaska ShoreZone program has so many applications that it has helped build capacity for the overall coastal programs and develop partnerships among organizations that may not have typically coordinated their goals in the past.
By adding a spatial element, GIS has made a significant scientific contribution to the program. For example, in late 2009, Harper assembled a 20,000-kilometer shoreline dataset as a deliverable for the National Oceanic and Atmospheric Administration (NOAA). Through the use of GIS, he was able to determine that important fish habitats, including salt marshes, eelgrass beds, understory kelps, and canopy kelps, collectively accounted for 87 percent of the shoreline. Scientists always had an ecological understanding of these habitats but no idea where they were located and how much existed.
In January 2010, the Alaska ShoreZone Partnership was presented with the Coastal America Spirit Award at the Alaska Marine Science Symposium, an annual gathering of about 800 scientists and researchers. The Coastal America Spirit Award recognizes exceptional projects that demonstrate the spirit of teamwork for group efforts that are poised to address challenging coastal issues.
Future Plans
An exciting new CORI project is to develop a nearshore habitat model using ArcGIS for the Queen Charlotte Strait that is based on observed ShoreZone data. This nearshore model, which predicts substrate, slope, and biotic assemblages of the shallow nearshore area, will serve as a planning framework for nearshore mapping projects, targeting sensitive habitats for higher-resolution seabed multibeam and videography surveys.
For more information, contact John Harper, marine geologist and CORI president (tel.: 250-658-4050, e-mail: john@coastalandoceans.com).