Where Wild Winds Rule
Understanding Mountain Gravity Waves Helps Optimize Glider Flights over the Andes
By Ren� Heise, Director, Mountain Wave Project
Highlights
- GIS was used for visualizing the flight path and the bands of wave lift in the complex terrain of the Andes.
- The ArcGIS Desktop tools verified forecasts through comparison with weather satellite images.
- GIS makes it possible to generate a simplified wave climatology of the Andes and visualization of turbulence.
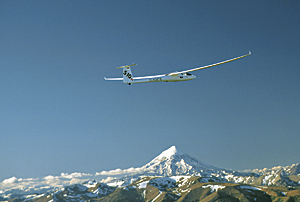
 In a field where science and adventure sports meet, the team of the Mountain Wave Project (MWP) (mountain-wave-project.com) is trying, in connection with the scientific section of the Organisation Scientifique et Technique du Vol � Voile, to carry out targeted research on internal gravity waves (i.e., the interface between the mountain and the atmosphere) in the atmosphere and put its findings to work in record-setting glider flights. This glider-based "research lab" demonstrates impressively how modern forecasting methods can be applied to identify relevant atmospheric structures (such as mountain waves).

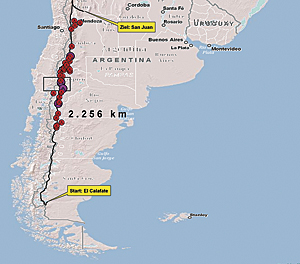
The flight path of the 2,256-kilometer world record gliding flight in a straight distance demonstrates good correlation with the bands of statistically derived areas of prevalent wave climbs.
The longest-ever distance flown in a glider—more than 3,000 kilometers in the mountain waves of the Andes in South America (at Formula 1 speed, at an altitude between 4,000 and 8,500 m over a flight time of 15 hours)—has set new standards in aeronautical sports. For this unprecedented flight, and for many others listed in the F�d�ration A�ronautique Internationale's gliding world record compendium, GIS was used for visualizing the flight path and the bands of wave lift in the complex terrain of the Andes, as well as displaying the relevant weather satellite images with charts from high-resolution numerical weather prediction models. Since its first Andes expedition in 1999, MWP has been acquiring data from more than 100 flights in Andean wave systems, all of them documented with Global Navigation Satellite System (GNSS) flight recorders.
Evaluation of GNSS Flight Recorder Data
During motorless sections of gliding flights, upward motions of the atmosphere ("lift") need to be used for the sailplane to gain altitude. There are several forms of lift, and it is of great interest in the analysis of long-distance gliding flights to distinguish between these different forms:
- The upward moving branch of mountain waves
- Lift related to the slopes in the landscape ("ridge lift")
- Lift related to warm air rising by convection ("thermals")
GNSS data recorders are commonly used to log GPS position fixes (time, latitude, longitude, altitude) every 1 to 15 seconds. A mathematical-statistical data analysis method was used to identify the lift related to mountain waves in these datasets, taking into account the height of the underlying terrain (SRTM30 data) and meteorological considerations.
More than 100 flights carried out in the mountain waves of the Cordillera of the Andes during the period from 1999 to 2010 were analyzed in this manner to yield lift diagrams.
Comparisons
For numerical weather forecasting, high-resolution, nonhydrostatic models (2 km horizontal grid distance) are being developed that are able to resolve mesoscale atmospheric phenomena such as mountain waves, foehn storms, anabatic and katabatic wind systems, and land/sea breeze circulation.

More than 100 flights carried out in the mountain waves of the Cordillera of the Andes between 1999 and 2010 were analyzed.
In the development of such models and their testing and operational application, visualization techniques using ArcGIS Desktop software's Naval Meteorology and Oceanography (METOC) and MWP Turbulence tools are valuable for verifying forecast products, such as vertical motion, air temperature, humidity, and wind fields, by comparison to observational data gathered from weather satellite images or derived products, such as temperature retrievals.
Turbulence Markers Downwind of the Andes
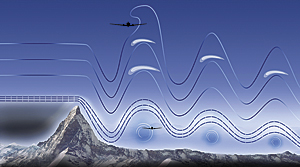
Although mountain waves themselves require laminar (and thus smooth) airflow, they can be related to severe or even extreme turbulence in the form of rotor-like air movements below, or breaking waves. Such turbulence can create severe hazards to commercial airline operations and other flights. It is therefore important to be able to predict areas that have a high potential of such turbulence.
While in the southernmost areas of the Andean mountain ranges (Patagonia), mountain waves—and with them the potential areas of severe turbulence—are often indicated by the occurrence of lenticular clouds, there is rarely sufficient moisture content available farther north for the generation of such clouds. This is particularly true for the busy air corridor between Buenos Aires and Mendoza, Argentina, and Santiago, Chile.

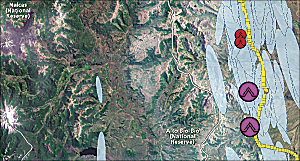
Zoomed view of green inset box above: In January 2010, a world record gliding flight was attained—2,256 kilometers straight from El Calafate, Argentina, to San Juan, Argentina. GIS analysis of mountain wave climbs (i.e., rising air) aided this success. Red turbulence symbols designate moderate to heavy turbulence with vertical speeds of 6 to 10 meters per second. Purple symbols depict extreme turbulence of over 10 meters per second.
To overcome this lack of turbulence indicators, turbulence markers created from the wave climbs as analyzed from the glider flights can be used for planning commercial flights under conditions conducive to the occurrence of mountain waves. Pinpointing areas of high mountain wave probability, visualized by ArcGIS tools, allows easy recognition of altitude, frequency, and intensity of likely turbulence encounters. With the aid of GIS, light tracks of aircraft can be analyzed, evaluated, and used to optimize flight routes.
About the Author
Ren� Heise is project founder and director of the nonprofit Mountain Wave Project. He has studied physics and meteorology at the Humboldt-University of Berlin and has presented all over the world.
For more information, contact Ren� Heise, MWP director (e-mail: rene.heise@t-online.de). The author wishes to thank the Beh�rden und Organisationen mit Sicherheitsaufgaben (BOS) team at ESRI Deutschland GmbH for its support in modifying the METOC tool.
