 The Magazine for
Esri Software Users
|
|
|
Modeling the Raging Waters
of Forest Falls
On July 11, 1999, an intense storm caused extensive flooding in a small mountain community in Southern California. Forest Falls, a town of approximately 3,500 located in Mill Creek Canyon at the base of Mt. San Gorgonio in the San Bernardino National Forest, was cut off from the surrounding area for 18 hours when debris six to eight feet deep blocked the only road out of the area. One person died, 15 houses were destroyed, and numerous houses and automobiles were damaged when torrents of water moved through three drainage basins in the area.
Though a storm event caused the flooding in Forest Falls, the conditions that set the stage for the flooding were the product of another famous hazard in Southern California-seismic activity. Actions of the adjacent Mission Creek strand of the San Andreas Fault, a rapidly uplifting portion of the San Bernardino Mountains, fashioned Mill Creek Canyon. The canyon's steep and eroded sides have a history of instability. Significant debris flows have been recorded in the area over the last 45 years.
Mike Price, mining solutions manager for Esri, was hiking in the area at the time the storm took place. He witnessed the violence of the storm and the damage caused by the ensuing flood. To learn more about why this storm was so destructive, he modeled the incident using ArcView GIS with the ArcView Spatial Analyst extension.
Base Data for the Model
Almost all the data used in this model already existed and was available free or at a reasonable price, or was created from existing data using ArcView Spatial Analyst. A Forest Service hiking map for the area was scanned and registered in Universal Transverse Mercator (UTM) in North American Datum for 1927 (NAD27). All measurements in the model are in meters, though some digital elevation model (DEM) data used solely for display enhancement was in feet. The U.S. Geological Survey (USGS) 7.5-minute map for the Forest Falls quadrangle was also scanned and registered in UTM NAD27.
Though these scanned maps provided features that orient map viewers, DEM data was needed to actually model the area. This data is available free of charge from the USGS EROS Web site. A DEM with 10-meter resolution was available for this area. Previous issues of ArcUser magazine described how to download and convert DEM, digital line graph (DLG), and Geographic Names Information System (GNIS) data that is available from the USGS Web site. Go to the "Terrain Modeling with ArcView GIS" page at the ArcUser Online Web site or see previous issues of ArcUser magazine for details on using this data. Using the DEM import capabilities in ArcView Spatial Analyst, this DEM was converted and brought into the project as a grid. Once the DEM data was brought into the model, it was classified by elevation and color ramped.
Creating Themes for Hillshade and Slope
Next, a hillshade theme was created from the DEM grid using basic functionality built into the ArcView Spatial Analyst interface. A hillshade is a map showing the shadows that would be cast by the terrain given a specified sun azimuth (compass location along the horizon) and altitude (height of the sun in the sky). Choosing Surface > Compute Hillshade was all that was needed to create a black-and-white hillshade theme. The hillshade theme was merged with the existing DEM data by clicking on the Advanced button in the Legend Editor and creating a Brightness theme using the classified and color-ramped DEM theme. The result was a more realistic and interesting view of the area.
Choosing Surface > Derive Slope and specifying slope measurement by degrees or slope created a new theme based on slope. 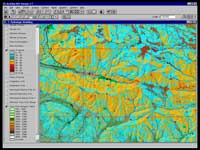 This model uses degrees. In classifying the slope theme, the effect of slope in this area was considered. Slopes of 15 degrees or less are considered buildable in this area if all other factors are favorable. Areas with buildable slope were made transparent. The angle of repose, the steepest slope at which most materials will stay in place typically ranges between 33 and 35 degrees. The terrain around Forest Falls is very rugged. Classifying the slope theme revealed large areas with more than 30 degrees of slope and some areas with as much as 80 degrees of slope, indicating very unstable terrain. This model uses degrees. In classifying the slope theme, the effect of slope in this area was considered. Slopes of 15 degrees or less are considered buildable in this area if all other factors are favorable. Areas with buildable slope were made transparent. The angle of repose, the steepest slope at which most materials will stay in place typically ranges between 33 and 35 degrees. The terrain around Forest Falls is very rugged. Classifying the slope theme revealed large areas with more than 30 degrees of slope and some areas with as much as 80 degrees of slope, indicating very unstable terrain.
Adding Detail
Additional data layers were added to provide more detailed features for the part of Forest Falls that was affected by flooding. Vector data for roads, section lines, wilderness boundaries, and label points in UTM NAD27 at 1:100,000 scale were downloaded from the USGS EROS site, converted, and added to the model. This data was posted over the DEM data.
Federal Emergency Management Agency (FEMA) Flood Insurance Rate Map (FIRM) data at 1:24,000 scale was also scanned in and registered. Though paper maps were scanned for use in this model, Digital Q3 Flood data for 7.5-minute quadrangle areas could have been used instead. Digital Q3 Flood data, containing key features of the FIRM paper maps, is available in compressed shapefile format from Esri's ArcData Online or in ArcInfo interchange (.e00) format from FEMA. FEMA maps were used to indicate the location of 100-year floodplain areas, flood zone designations, roads, and drainages. Using functionality available from the menu of ArcView Spatial Analyst (Theme > Create Buffers), the flood zones were buffered to provide a margin of safety.
Modeling Water Movement
ArcView Spatial Analyst 1.1 comes with a new hydrology extension, Hydrologic Modeling Sample Extension v11. Using this sample extension, watershed and stream networks can be created using DEM data, the physical and geometric properties of watersheds can be calculated, and these properties can be aggregated into a single attribute table. This table can be used directly with established hydrologic models or can be reformatted and used by the Hydrologic Modeling System (HMS) developed by the Hydrologic Engineering Center (HEC).
In this instance, the hydrology extension was used to calculate the flow direction. Next, sinks were identified and filled.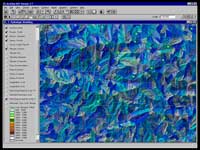 A sink is a cell or set of spatially connected cells whose flow direction cannot be assigned. Sinks in elevation data are most commonly due to errors in the data. Choosing Hydro > Fill Sinks will usually correct the data. Finally, a flow accumulation for each cell in the Forest Falls DEM was generated. The basin data, which was imported as grid data, was classified, color ramped, and a hillshade was created and merged using the advanced legend features available in ArcView Spatial Analyst. The grid basin data was then converted to polygon shapefiles. Posting vector data showing rivers and streams over the basin theme made the path of runoff through the area apparent. A sink is a cell or set of spatially connected cells whose flow direction cannot be assigned. Sinks in elevation data are most commonly due to errors in the data. Choosing Hydro > Fill Sinks will usually correct the data. Finally, a flow accumulation for each cell in the Forest Falls DEM was generated. The basin data, which was imported as grid data, was classified, color ramped, and a hillshade was created and merged using the advanced legend features available in ArcView Spatial Analyst. The grid basin data was then converted to polygon shapefiles. Posting vector data showing rivers and streams over the basin theme made the path of runoff through the area apparent.
Adding Vegetation Data
The presence or absence of vegetation affects how surface water will move across the landscape. Vegetation data from the California GAP Analysis was used and brought in as a grid. This data, classified according to standard vegetation models, was typical for the area and included group coverage classifications such as Sierra and Mixed Conifer, Mixed Chaparral, and Sub-Alpine Conifer. After adding this theme, it became apparent that a large area southeast of Forest Falls had no significant vegetation. There was nothing to hold back or slow runoff in this area. The lack of vegetation adjacent to the Snow Creek and Slide Creek drainages, coupled with a half inch of rain that fell earlier on July 11, 1999, in the same area, meant that any additional rain would come right off the hillside.
Gauging Rainfall Using Doppler Data
Doppler radar data describing rainfall for Forest Falls during the storm was used to calculate the amount and distribution of rain. This data was obtained from worldwide supplier of meteorological data, Kavouras: A DTN Company. 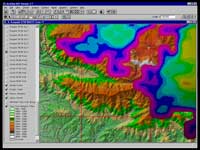 Though Doppler radar data has been used on maps for some time, the ability to reproject and grid this data quickly using ArcView Spatial Analyst is relatively new and presents additional opportunities to use this data. Though Doppler radar data has been used on maps for some time, the ability to reproject and grid this data quickly using ArcView Spatial Analyst is relatively new and presents additional opportunities to use this data.
This data, containing measurements taken at five-minute intervals during the storm, was splined, sampled to 10-meter resolution, and calibrated against known rainfall samples taken during the storm. The resulting rainfall summary theme showed that the entire area received more than two inches of rain during a period of less than two hours and that most of the rain fell within a one-hour period. However, the area around the Snow Creek, Slide Creek, and Bridal Veil drainages received even more rain-three inches during this same period.
Measuring Water Through Individual Drainages
By creating separate polygons for the Snow Creek, Slide Creek, and Bridal Veil drainages and measuring against the rainfall theme, the amount of water moving through individual drainages during the storm event can be gauged. From the model, it was determined that more than 50 million gallons of water passed through the Snow Creek drainage, the location of the fatality and most of the property loss.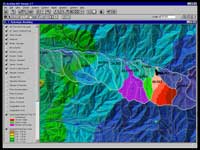 Though half that amount of water, 25 million gallons, moved through the Slide Creek drainage, the 40-degree slope, combined with the lack of vegetation, caused approximately 1,000 linear feet of debris six to eight feet deep to move through the drainage and onto Valley of the Falls Drive, preventing residents and summer guests from leaving the area. Propane tanks from the houses in Snow Creek were carried with by water and debris making the situation hazardous for emergency responders. In contrast, the heavy vegetation of the adjacent Bridal Veil drainage limited the volume of runoff despite the fact that 35 million gallons moved through the area. Though half that amount of water, 25 million gallons, moved through the Slide Creek drainage, the 40-degree slope, combined with the lack of vegetation, caused approximately 1,000 linear feet of debris six to eight feet deep to move through the drainage and onto Valley of the Falls Drive, preventing residents and summer guests from leaving the area. Propane tanks from the houses in Snow Creek were carried with by water and debris making the situation hazardous for emergency responders. In contrast, the heavy vegetation of the adjacent Bridal Veil drainage limited the volume of runoff despite the fact that 35 million gallons moved through the area.
A Powerful Tool for Public Safety
Though this model was created after the event, using GIS to model the effects of natural disasters can be used to plan both mitigation efforts and emergency response. Historical data on disaster characteristics, such as rainfall data for severe storms, can be used to create scenarios that gauge risk to life and property. ArcView GIS with the ArcView Spatial Analyst extension provides all the tools needed to combine data from many sources, derive additional themes, and analyze the information.
|
