ArcUser Online
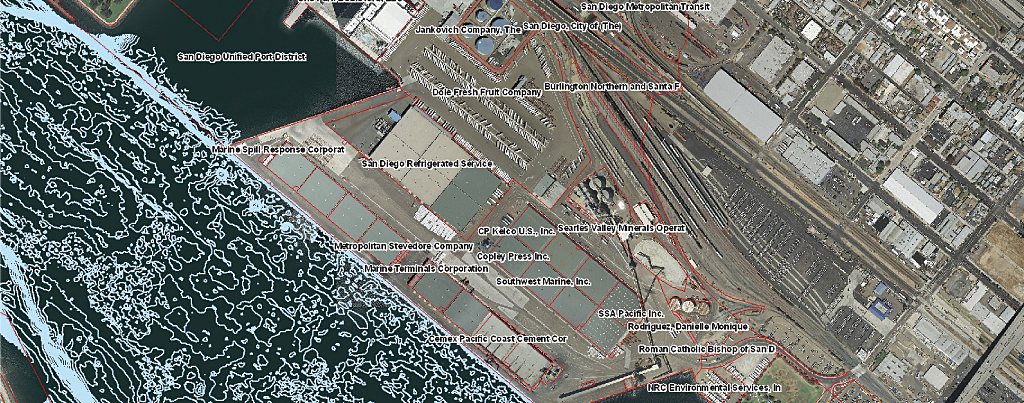
The port had been using GIS since the 1990s in the engineering and real estate departments. Although both departments were essentially creating and using the same data, this data was not shared and efforts were duplicated. However, there was no easy way to share data. "Our vision of creating a common operating picture with a geographic perspective gives everyone the information they require along with the basic GIS functionality necessary to do their jobs in the best way they can," explained Malcolm Meikle, geographic information systems coordinator for the San Diego Unified Port District. Making GIS Part of the Daily Workflow
Three years ago the port's information technology department added ArcGIS Server, a complete and integrated server-based GIS, to its ArcGIS Desktop software. This change made facilities data accessible to the departments that needed it. The goal was to streamline workflows by identifying tasks, questions, and requests that were best answered using a geographic approach. This approach paid off. "Using GIS, the time it takes to access critical information went from seven to eight hours to mere minutes because the data is now located in one location and it is up-to-date," said Meikle. "Just this change has sped up our workflow and is driving faster, more informed decision making." The port worked with various departments to customize interfaces using ArcGIS Desktop and generic Web browsers to give access to port data that now resides in a single location: a geodatabase. The geodatabase is the common data storage and management framework for ArcGIS Server. Source data is also managed in the geodatabase, which minimizes redundant copies and eliminates the possibility of varying versions of data. Adopting new technology to improve business processes can be a daunting task. The port found it needed to keep daily tasks as unchanged as possible while incorporating tools for bringing real benefits to the users. CAD has continued as the technology used in the data production environment for creating drawing files for structures around the port. Designers use the ArcGIS for AutoCAD extension, a free tool from Esri, to bring GIS data into the CAD environment. Using this extension, engineers can continue working with familiar software while gaining access to GIS data. It can be GIS data created in-house or GIS data from ArcGIS Online, an Esri-hosted repository of GIS maps, layers, and tools.
ArcGIS for AutoCAD has proven to be a valuable tool since it allows operators to see the GIS basemap in their native CAD environment and find answers to questions because all the information is accessible through the basemap. "AutoCAD users are drawn to this tool because it gives them a window into GIS information while still allowing them to work in their familiar AutoCAD environment," said Ari Isaak, a GIS analyst for the San Diego District Port. Creating an enterprise GIS has driven the implementation of data and file structure standards in the engineering department so CAD data can be seamlessly displayed and analyzed through the wide variety of ArcGIS Server clients. Web-based clients, accessible to all port employees, provide new tools for understanding the infrastructure the port manages and maintains. Users in engineering management and general services and asset managers in the real estate department also use these tools. Moving data from CAD to GIS, CAD operators must follow naming conventions for drawings, layers, objects, and attribute blocks. The port adopted the United States National CAD Standard—which is used by organizations throughout the United States for exchanging building design and construction data—as a guideline for its own CAD data standards. The Department of Homeland Security Geospatial Data Model is used as a data model guide.
All scanned paper plat and record drawings are accessed by an intermediate table that contains relevant information about the documents that are stored in the geodatabase. Standardizing layer naming conventions for new drawings, as well as the creation of a master CAD drawing, means that engineering staff update those files instead of storing these drawings on local drives. This ensures that every department can understand and use GIS data. This has made attribution much easier, and CAD operators no longer need to guess how to describe features in the drawings. Just Add ImageryAnother advantage of this system is the ability to view and use imagery in the CAD stations using the ArcGIS for AutoCAD tool. In the past, when engineers added TIFF images to AutoCAD—one at a time—the draw time was lengthy. If a drawing spanned more than one image, each image had to be loaded separately. This process was time consuming and frustrating for operators. "CAD designers love ArcGIS for AutoCAD if for no other reason than they finally have access to very high-resolution aerial [photos] quickly," said Isaak. The port has two sources for imagery: .3-meter resolution aerial photographs from ArcGIS Online and 4-inch pixel resolution aerial photos flown in April 2009 by the port. The 4-inch resolution photos are used for quality control and as a source for creating new data. To use the aerials for these purposes, engineers must follow strict standards and use the same coordinate system employed by the GIS operators. This simple change has been advantageous. Now, drawings can be viewed in the correct geographic space even if an image is not used as a backdrop. Drawings can also be located by performing a spatial search rather than by the name of a drawing. Now drawings can be used for more than one project. Previously, drawings had to be copied and pasted into work projects. These changes have cut down on the errors inherent in copying data and the amount of file space needed to store the drawings. Because the source data is managed in the GIS database, it can be used more than once. Now, everyone in the port is using the most accurate data. Web-Based Enterprise GIS throughout the Port
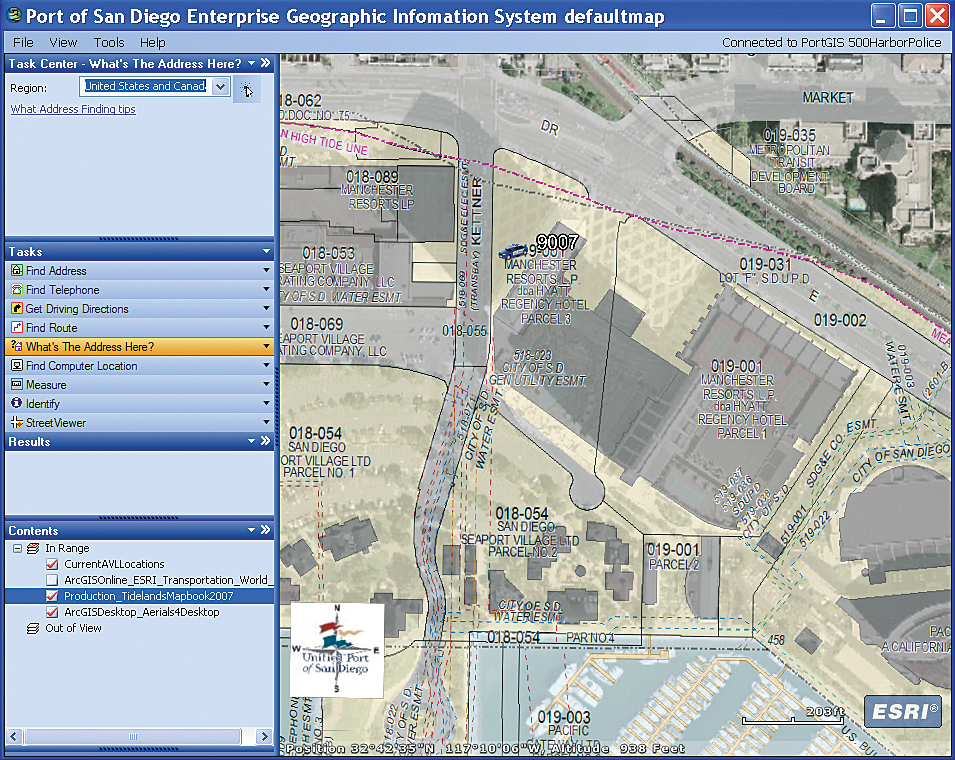
"By using geographic data and systems, the port is able to use geography as the common factor to bring together data that otherwise is difficult to integrate," said Meikle. In 2007, when ArcGIS was adopted, the GIS group moved from the real estate to the information technology (IT) department. This allowed IT to manage and disseminate GIS data throughout the port. Access to the GIS data and system has empowered the port's employees to integrate their own independently developed workflows for managing spatial data and accomplishing their work using the information they need. Departments that traditionally hadn't thought about using the port's facility information, such as the harbor police, are now users. Today, the harbor police employs two applications for tracking vehicles around port property—one desktop application built with ArcGIS Explorer and an in-car application that displayed map data in Web browsers that was created with OpenLayers, an open source JavaScript library. Staff throughout the port can access the GIS through the PortGIS Resource Center. This central gateway to GIS information is accessed by clicking an icon on the port's internal Web home page. Here, staff can choose one of three Web applications—PortGIS Explorer, PortGIS Utilities, or PortGIS Projects—designed for various tasks and departments. The most used GIS Web application is PortGIS Explorer. Staff can access high-resolution aerial photos and the port's TideLands Mapbook, which represents the port's overall geographic interests at the Port of San Diego. A user can navigate around the map to see exactly the information they need, turn on and off layers, and create maps to include in reports and e-mails. Data can be queried and measurements between two or more points obtained. The PortGIS Utilities application focuses on current conditions. End users can view utility line work and access PDFs of official engineering drawings by location. This application furnishes all the functionality of PortGIS Explorer as well as georeferenced maps from important documents. PortGIS Utilities brings together the port's development effort affecting all the managed land and creates a common operating picture for departments as they move forward in their planning efforts. The PortGIS Projects application deals with future developments, the regulatory process, and obligations to which the port is committed. Standards Make Workers More Efficient
PortGIS Utilities is the central clearinghouse for the port's utilities data, including electrical, fire, natural gas, fuel, sanitary sewer, storm drain, telephone, water, chemical, fiber optics, and communication lines. The data is converted to Esri feature classes using a batch file, which runs nightly. Instead of the engineers working with a traditional file system to structure the data, the data is spatially indexed so it can be more easily located. This also allows engineers to share data with the rest of the port. Simply having the data created using standards that are managed and shared from one location makes it much easier for staff to find answers. The entire system was built using the Microsoft .NET framework, a file geodatabase, and Windows Server 2008 on a 64-bit machine. Clients were created using the .NET Web Application Development Framework (ADF) that comes with ArcGIS Server, which was customized using Visual Studio and incorporated many ideas from the .NET ADF Code gallery at the Esri Web site. The IT department also created a streamlined method that assists users by installing software remotely. If staff members have questions, they can send e-mails to the IT department or check out a %scrachworkspace% (posdgis.wordpress.com/), a blog maintained by the port GIS professionals. Today port staff can not only ask questions like How much square footage is available? but also reach further into the data by gaining access to official record drawings and viewing the relationship between a developer's plans and the geographic interests of the port. GIS is used in every department. It helps the harbor police track police cars. The general services department uses it for engineering data accumulation and maintenance. The finance department uses GIS to track money coming into the port by tracking corporate leases, maintaining parking meters, and other activities. Today the more than 600 employees at the port can use GIS data and Web-based applications. For more information, contact Malcolm Meikle Ari Isaak Visit the CAD Integration Resource Center at the ArcGIS Resource Center. For more information on on ArcGIS for AutoCAD and to download the free extension, visit www.esri.com/arcgisforautocad. |
 This article as a