ArcUser
Winter 2012 Edition
Answering Emergency Management Information Needs
This article as a PDF.
Whether modeling disaster consequences or alerting residents to an impending tsunami, GIS-driven maps and apps help emergency personnel save lives, mitigate property damage, and speed recovery.

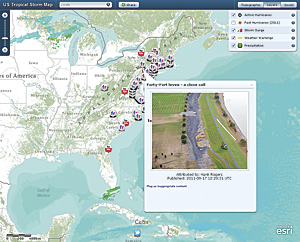
Live incident response apps can work two ways. They can share information about a disaster or capture additional data from Facebook, Twitter, Flickr, and YouTube posts.
Situational awareness is the key to effective emergency management. The GIS-driven common operating picture (COP) has evolved over the past decade to furnish situational awareness and support missions across all phases of the emergency management cycle. COP is enhanced by GIS technology, not by the implementation of a single application. GIS is a platform for developing mission-specific applications that incorporate the abundance of GIS-ready data with operational data continually updated from the field to support analysis, decision making, and collaboration.
Before GIS was applied to emergency management, the information base for decisions was often limited to the work experience and intuition of individual emergency managers. GIS tremendously expanded the resources managers could consider when evaluating a situation.
Initially, GIS use focused on response efforts, especially the production of paper maps for briefings and personnel in the field. Static maps produced by the first Internet mapping websites also improved situational awareness for managers and incident commanders and kept the public informed. However, paper maps and static images both suffered from latency and the absence of interactivity.
The timeliness of both products was dependent on the update cycle and could not provide the most current information. Maps generated to answer one set of questions could not be queried to answer new questions spawned by response situations in constant flux or address additional scenarios when working on planning, mitigation, or preparedness efforts.
The initial challenge when setting up emergency management GIS applications was assembling and integrating the most current and accurate datasets. Because disasters don't respect jurisdictional boundaries, at least some of the required data would likely have to come from other government agencies or organizations. Building and maintaining regional foundation datasets to meet this need was a formidable task from both technological and organizational standpoints.
New patterns of GIS have emerged that answer needs for timeliness, interactivity, accessibility, and collaboration. ArcGIS Online is a pivotal part of these new capabilities. By using an open pattern of implementation that extends into the cloud, ArcGIS Online replaces downloading, processing, and managing datasets with accessing geospatial information contained in map services, map layers, and tools. Topographic, imagery, shaded relief, ocean, reference, and other basemaps, created by Esri and available from ArcGIS Online, can be immediately incorporated as a foundation for mapping operational layers. In addition to a gallery of basemaps, ArcGIS Online hosts a community of users who share maps, services, layers, apps, and tools that can be used to create intelligent maps by mashing up these resources with local operational data.

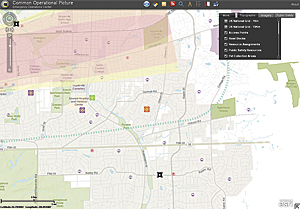
The Public Safety Common Operational Picture template, available from arcgis.com, offers a standard overview of an incident, providing information that enables the incident commander and any supporting agencies to make effective decisions.
Demographic information, important to all aspects of emergency management, can be accessed as thematic map layers created by Esri and available from arcgis.com. These layers are based on current-year demographics. In addition to free resources, a full spectrum of ready-to-use, high-quality geospatial data licensed from industry-leading providers or built with Esri's proven methodologies can also be purchased.
Furnishing data to web apps and desktop GIS as map services also allows the use of live feeds that are critical when responding to the rapidly unfolding events of an incident. Dynamic data from the Pacific Disaster Center is available as an ArcGIS for Server service as well as live feeds for wind speed and direction, US weather warnings, and ground motion and shaking intensity.
Providing a wealth of data already configured in maps, map templates, and map layers means that data can be used immediately in interactive maps that can be styled, searched, queried, embedded, and shared.
The development and release of ArcGIS APIs for JavaScript, Flex, and Silverlight have furthered the goal of making current geospatial information accessible and comprehensible to nonspecialists. Interactive maps and apps for the web and mobile devices created with web mapping APIs can mash up online services, incorporate GeoRSS and social media feeds, and add tools and widgets.
Extending GIS using cloud computing platforms, such as ArcGIS for Server deployed on the Amazon Elastic Compute Cloud (EC2), has made web maps and apps almost instantly accessible for response to disasters. Deploying ArcGIS for Server via EC2 lets responders rapidly provide services without procuring hardware, installing software, or impacting existing on-premises infrastructure. An Amazon Machine Image (AMI) obtained from Esri comes with ArcGIS for Server installed and configured along with ArcGIS for Desktop, ArcSDE on Microsoft SQL Server Express, and 100 GB of attached storage. ArcGIS for Server can be configured to automatically spin up new instances during demand spikes and efficiently distribute capacity across instances.
The value of GIS in the cloud was demonstrated in 2010 when extensive flooding covered three-quarters of the state of Queensland, Australia. Responding agencies needed quick access to information on this rapidly changing situation. Ben Somerville and Nick Miller of Esri Australia Pty. Ltd. stood up a COP app in just 12 hours that gave access to the latest, most accurate information on the situation in Brisbane.
Live incident response apps have become an increasingly popular method for sharing information about a disaster or capturing additional data from the public via posts to Facebook, Twitter, Flickr, and YouTube. Simply download the Public Information Map template to learn how to create and deploy public media maps. To use data from social media for advanced visualization, the Ushahidi2ArcGIS ArcGIS for Desktop add-in prototype connects to a Ushahidi instance with the API enabled and can download Ushahidi data into a geodatabase.
Mobile devices enabled by mobile, global networks let responders enjoy bidirectional situational awareness in near real time. The Alabama Marine Police demonstrated how bidirectional capability could be applied to a large-scale disaster event. Responding to the massive oil spill in the Gulf of Mexico caused by the Deepwater Horizon incident in 2010, crews documented the location of booms and other apparatus using focused apps on mobile devices. Maps, data, images, and video were immediately transmitted to incident command via a Broadband Global Area Network (BGAN). A Flex-based viewer displayed current maps at daily briefings. The result: everyone in a five-state area could see the same information at the same time—a tremendous leap forward in situational awareness.
Beyond heightened situational awareness and improvements in the processes associated with the entire emergency management cycle, GIS—through the GeoDesign framework—is being applied to the underlying cause of an increasing number of natural disasters: climate change.
GeoDesign, which brings together geospatial technologies and design processes to create innovative outcomes, is being used by governments, and nongovernmental organizations (NGOs) to make existing communities more resilient and new communities more sustainable.