ArcUser Online
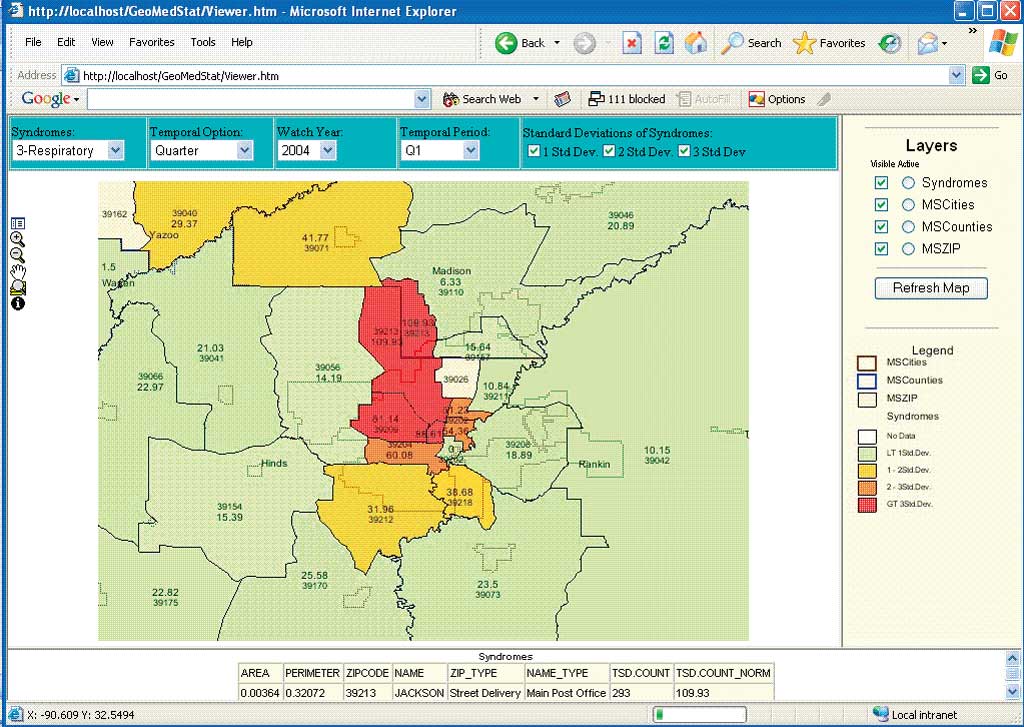
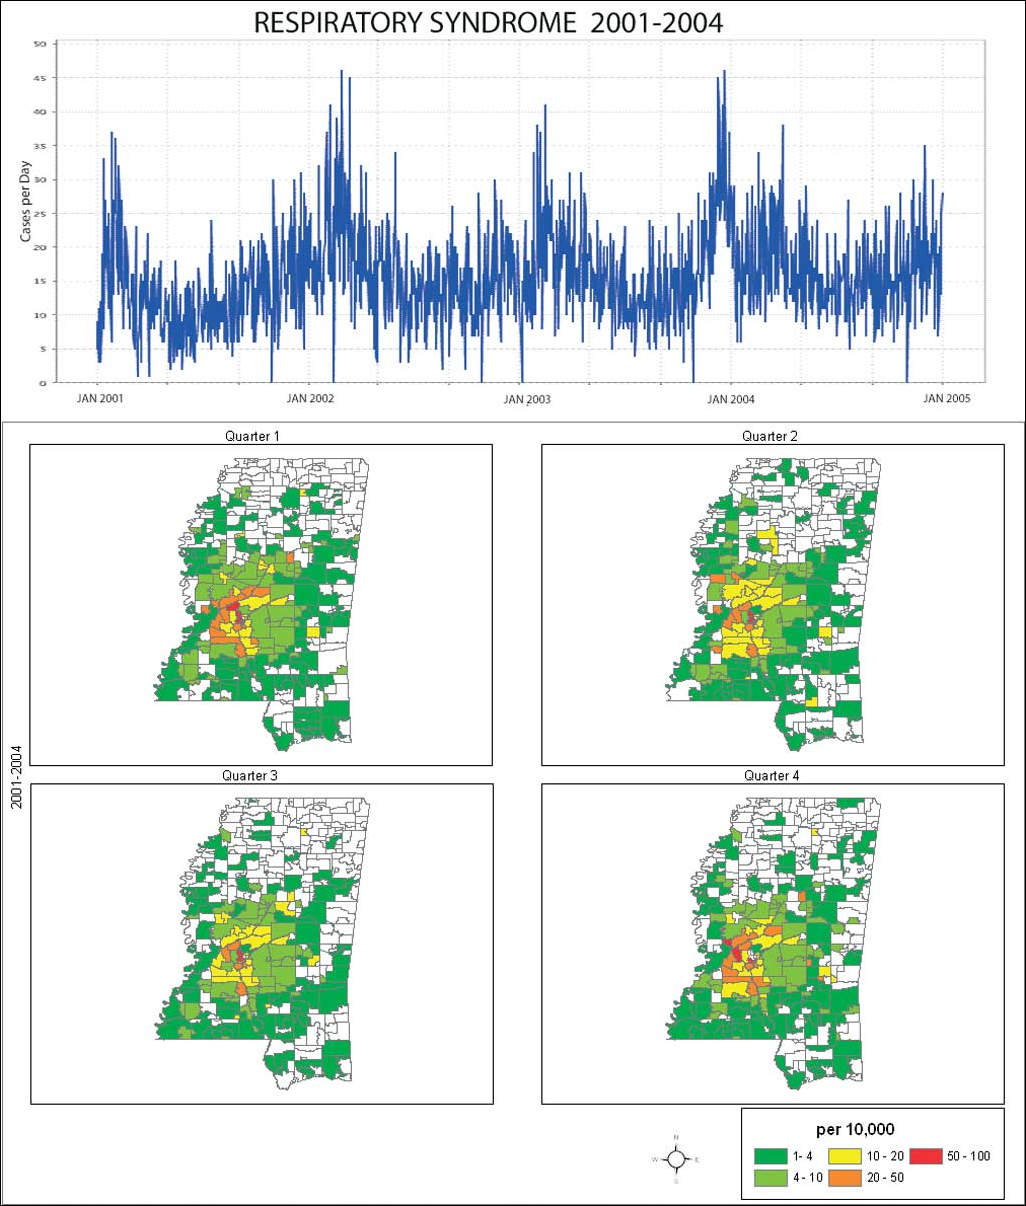
Syndromic surveillance is the utilization of crude health data for the rapid detection of disease outbreaks or bioterrorism attacks. These systems have been deployed using routinely collected laboratory, pharmacy, or clinical data such as a patient's chief complaint on arrival at an emergency department. Existing systems have focused on data collection methods, characteristics of the data collected, and analytical methods to detect disease outbreaks. Beyond actually detecting an epidemic, the availability of additional demographic information—such as age, sex, and location—is valuable for understanding the etiology and dynamics of an outbreak. The interpretation of such large datasets is difficult. GIS can play an important role in surveillance systems and help decision makers interpret and analyze this data. In particular, geographic information about the location of cases and their temporal evolution would be invaluable to those responsible for identifying and controlling an outbreak. The use of these systems for routine health and disease surveillance may be even more useful than monitoring for disease outbreaks or bioterrorism attacks. The authors' research focuses on implementing Web-based GIS functions into a real-time syndromic surveillance system. The system includes four major components: real-time data collection, syndrome classification, dynamic spatial mapping, and query capabilities. Query functions allow filtering of the data by syndrome and demographic variables such as age and sex. Queries can focus on particular geographic areas, such as ZIP Code or county, and permit analysis of temporal trends using user-determined dates. The Web-based nature of the system will allow anyone with access privileges to query the system for epidemiological analysis. ImplementationGeoMedStat can map the spatial distribution of infectious diseases of interest in any given time period and query disease-related information in spatial data layers. ArcIMS delivers dynamic maps and GIS data and services via the Web. For rapid application development, ArcIMS includes Designer, a component to create ArcIMS viewers using prebuilt templates. However, the ArcIMS prebuilt viewers support only limited customization capability so a customized viewer was developed using JavaScript, HTML, and DHTML to support flexible mapping functions in this system. Data SourceHealth care encounter data (i.e., data about interactions with the health care system), particularly emergency department (ED) data, is readily available and well-suited to syndromic surveillance. ED discharge diagnosis data from May 2000 to February 2005, consisting of a total of 87,350 records, was obtained from UMMC's emergency department patient database. These records were collected and used in this study. ED data is acquired using an electronic medical record in real time, and the discharge diagnoses (or ICD-9 codes) are coded automatically at the time the patient leaves the ED. ICD-9—an abbreviation of the International Classification of Diseases, Ninth Revision, Clinical Modification—was developed to allow the assignment of codes to diagnoses and procedures associated with hospital utilization in the United States. The ICD-9 codes represent ED patients' final diagnoses. One patient visit may have multiple diagnoses and associated ICD-9 codes, and each ICD-9 code in a visit was ranked in order, with the primary diagnosis first and additional diagnoses listed in rank order. The use of ICD-9 codes obviates the need to use the much less specific chief complaint data that is used in many other syndromic surveillance applications. Data elements imported from the ED database include encounter date, patient ZIP Code, city, sex, age, ICD-9 code, ICD-9 code description, and ICD-9 rank. Patient identification information is excluded. ICD-9 codes were mapped to different syndrome categories. The data could be imported from the ED database into the surveillance application at arbitrary time intervals. However, for practical reasons, in the current implementation, a time interval of 24 hours was chosen based on ED census data. Shorter intervals did not seem to offer any significant advantage. Syndrome ClassificationArchitects of the Electronic Surveillance System for the Early Notification of Community-based Epidemics (ESSENCE) system developed a mapping of ICD-9 codes to syndrome categories that has been widely distributed. The Centers for Disease Control and Prevention (CDC) identified 11 syndrome categories and the corresponding ICD-9 codes that can be used in syndromic surveillance programs. Syndromic surveillance systems have used ED chief complaints or ED discharge diagnosis data for syndrome categorization. Free-text chief complaints can be grouped into syndromes using a statistical model such as Complaint Coder (CoCo), a Bayesian classifier. Studies have shown that ICD-9 codes more accurately classify patients into syndromes than chief complaints. However, ICD-9 codes are often not available in a timely manner; therefore, many systems use chief complaint data. One GeoMedStat advantage is the rapid availability of specific ICD-9 discharge diagnoses.
Although seven syndrome categories (gastrointestinal, botulism-like, hemorrhagic, respiratory, neurological, rash, and constitutional) were selected for monitoring, the system can be easily modified for any combination of ICD-9 categories. The ED discharge diagnosis data was automatically grouped into the seven syndromes based on corresponding ICD-9 codes. Two kinds of redundancy in ED data need to be considered when data is classified in the syndromic surveillance system. One is that multiple ICD-9 codes for a single patient visit may belong to the same syndrome group. This redundancy will overestimate the number of cases in a syndrome category. It is removed programmatically to eliminate multiple insertions found in 18.9 percent of the records. Second, multiple ICD-9 codes for a visit may belong to different syndrome groups because a patient's symptoms may fall into more than one syndrome. This redundancy includes important information and is left intact in the database. Continued on page 2 |