ArcUser Online
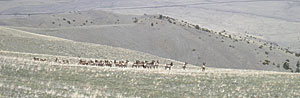
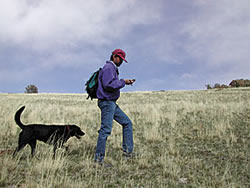
Environmental scientists at Ecosystem Research Group (ERG) recently completed a study to help resolve a long-standing question between ranchers and public land managers in Montana. Are elk and cattle successfully sharing the same range in the Elkhorn Mountains of Montana? Other questions follow: Exactly where are the elk and cattle grazing? Is summer use by cattle compatible with the forage requirements for elk on their winter range? Is the ecological condition of elk winter range in the Elkhorn Mountains degrading? Are there too many cattle on the grazing allotments or too many elk in the elk herd units? The study was conducted for the Elkhorn Working Group, a collaboration of local stakeholders and public agencies that includes representatives from Helena National Forest; Montana Fish, Wildlife & Parks; Rocky Mountain Elk Foundation; Bureau of Land Management; private ranchers; and Broadwater Conservation District. ERG first collected field measurements, then used creative GIS techniques to synthesize the information. Over a three-year period, vegetation specialists routinely measured variables at several locations across the study area to quantify the level of use by cattle and elk by season. Those variables included vegetation production, percent of forage utilization, ecological condition, and similarity index (comparison to historic grassland communities).
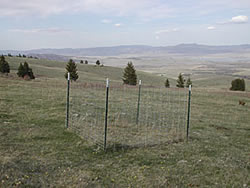
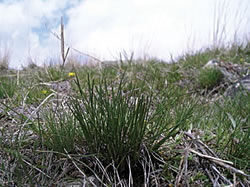
Such range measurements provide great information for inference about grazing interactions. Vegetation production tells how much forage is available in a given year. Percent of forage utilization estimates the amount used compared to the amount produced. Measuring ecological condition and the similarity index of the vegetative resource help map areas that historically had high levels of use so that the ways elk and cattle are currently using forage versus historical high-use areas can be compared. Areas where dual use is highest and the land is most impacted can also be mapped. When measured seasonally and with carefully placed grazing enclosures, studies can measure how much forage the cattle are leaving for the elk and how much of the remaining forage elk are using and leaving behind. The authors of this article, Melanie A. Smith and C. Travis Benton, with support from other GIS technicians at ERG, performed key tasks such as mapping hot spots where elk and cattle grazing overlap and describing the environmental characteristics of the area including historic range of variability and conifer encroachment. Data Sources
GIS specialists acquired eight years of elk radio-collar telemetry data (approximately 700 elk and 10,000 relocation points) from Montana Fish, Wildlife & Parks. Satellite Image Landcover Classification (SILC) data was collected from the Helena National Forest, and digital elevation model (DEM) data was downloaded from the Montana Natural Resource Information System (NRIS). Elk herd unit boundaries and cattle grazing allotment boundaries were compiled from Forest Service, Bureau of Land Management, and Montana Fish, Wildlife & Parks documents and databases. Local stakeholders wrote comments onto large field maps at public meetings that provided information about cattle use, elk calving grounds, and areas where forage conflicts are known to exist. Finding Areas Suitable for Cattle GrazingThe GIS analysis consisted of four major steps.
Tree canopy cover measurements from SILC data were classified into four categories: 0–9 percent, 10–24 percent, 25–44 percent, and 45 percent and greater. National Agriculture Imagery Program (NAIP) digital orthophoto quadrangles (DOQs) from 2005 were visually inspected for additional high-canopy coverage areas, and those areas identified were digitized, converted to raster, and merged into the 45 percent and greater cover category using the ArcGIS Spatial Analyst extension. Next, a mosaicked DEM was reclassified into four slope categories: 0–15 percent, 16–30 percent, 31–60 percent, and greater than 60 percent. Using the Raster Calculator in ArcMap, the grids for tree canopy cover and slope were added, then divided by two to yield a range of numbers between 1 and 4. In this classification system, 1 represents excellent grazeability and 4 represents poor grazeability. All half numbers were rounded down. Table 1 below illustrates this process. Additional areas of rock outcrop and areas infrequently used by cattle were merged into the poor category; all areas classified as poor were then removed from further study.
Locating High Elk Presence in the Project Area
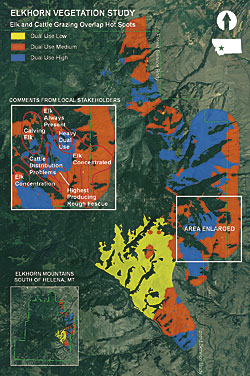
More than 10,000 elk relocation points were used to create a density grid using the ArcGIS Spatial Analyst extension. The kernel density function was used with a search radius of one mile. Results were calculated in relocations per square mile. The total number of relocations was divided by the number of square miles in the project area. The resulting statistic described the number of relocations per square mile, assuming uniform distribution. This was used as a threshold for significant elk presence. Using the Raster Calculator, all cells in the density grid greater than the threshold were extracted. The result, labeled Preferential Use, consisted of those areas elk seem to prefer because they are present in these areas more frequently than would be the case if they were distributed uniformly across the area. Finding Elk and Cattle Grazing Overlap Hot Spots
The cattle grazing suitability and the elk preferential use grids were each reclassified to a value of 1, and the two grids were multiplied using the Raster Calculator. This returned the overlap areas between the two grids—the boundary of the elk/cattle overlap hot spots. From there, the degree of use within the boundary was determined. Measurements of the utilization of available vegetation collected by ERG over a two-year period were interpolated. This was done using the Inverse Distance Weighted method with a layer of pasture fences used as barriers in the calculation. The resulting grid was reclassified into three categories: low, medium, and high utilization. This was the final product. As a further step, these findings were compared with comments drawn on maps by local stakeholders. The comments aligned well with the GIS analysis and met the expectations of the GIS specialists involved, the Elkhorn Working Group, and stakeholders. Describing Environmental Characteristics of the Area
Additional GIS techniques were employed during this study. While describing the environmental characteristics of the project area, some of the oldest landscape data and newest GIS technologies were integrated. Portions of a historic Forest Service 1922 rangeland vegetation map were scanned, rectified, and digitized. The vegetation classification from the map was compared to rectified aerial photos from the 1950s, 1970s, and 1990s for the purpose of studying conifer encroachment into historic grassland communities. The Forest Service's SIMulating Patterns and Processes at Landscape scaLEs (SIMPPLLE) Model was also used. SIMPPLLE is a spatially explicit landscape model that forecasts future and estimates historic changes in vegetation based on natural processes and management activities. ERG's GIS staff modeled the Elkhorn Mountains to construct a better picture of the historic range of variability of the landscape to quantify historic vegetation production and current forest encroachment. Conclusion
This project significantly contributed to the understanding of vegetation dynamics in the Elkhorn Mountains of Montana and answered some long-standing questions regarding elk and cattle interactions. Findings from the Elkhorn Vegetation Study were used to recommend improved cattle allotment management strategies, prioritize areas for pasture fence realignments, propose weed control measures, and recommend further sampling and monitoring. In June 2006, the methods, results, and maps for this three-year study were published by ERG for the Elkhorn Working Group. Visit the Projects section of ERG Web site (www.ecosystemrg.com) to read more about this study. For more information, contact Melanie Smith Ecosystem Research Group About the Authors
Melanie Smith is an environmental scientist and the GIS director for Ecosystem Research Group, a private environmental consulting company in Missoula, Montana. In the course of completing her master's degree in geography from the University of Montana, she created a spatially explicit dynamic model that simulates habitat interactions of nesting northern goshawks. She holds a bachelor's degree in environmental studies from Prescott College, Arizona, and her interests include landscape modeling and ecology; spatial statistics; and wildlife habitat analysis, particularly for avian species.
Travis Benton is an environmental scientist and GIS specialist for Ecosystem Research Group in Missoula, Montana. He earned his bachelor's degree in forest resource conservation from the University of Montana in 1999. His professional work and interests include rangeland vegetation mapping and sampling, plant ecology, and landscape vegetation modeling. |