ArcUser Online
Spring 2011 Edition
Link a Graph to a Time-Aware Map Layer
This article as a PDF.
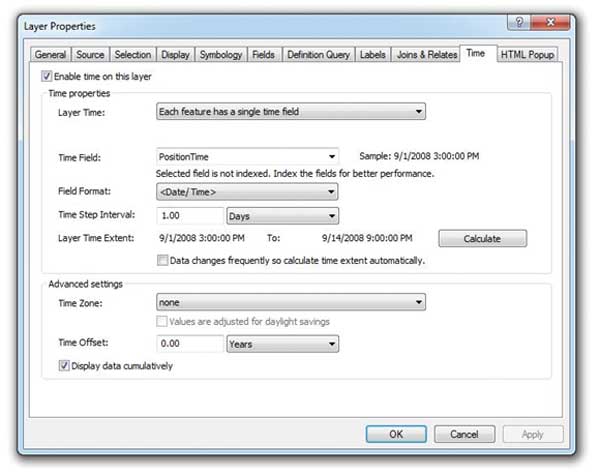
Set the map layer's time properties.
Using the new Time Slider and time-aware map layers introduced in ArcGIS 10 with previously existing charting and graphing capabilities, you can watch your data as it transforms over seconds, minutes, hours, days, or even years through animating a map layer and any graph derived from it—simultaneously. Although this sounds complicated, it's actually quite simple to do.
Making a Time-Aware Layer
This article walks the reader through the creation of a time-aware graph. It uses a map layer that contains a series of position reports for Hurricane Ike, which occurred in the Gulf of Mexico in 2008. (Data provided by HurricaneMapping.com.) Each point feature has a date/time stamp and an estimate of the maximum wind speed at that time.
The vertical area graph based on the time-aware layer will inherit the time properties of that layer.
Step 1: Set the Layer's Time Properties
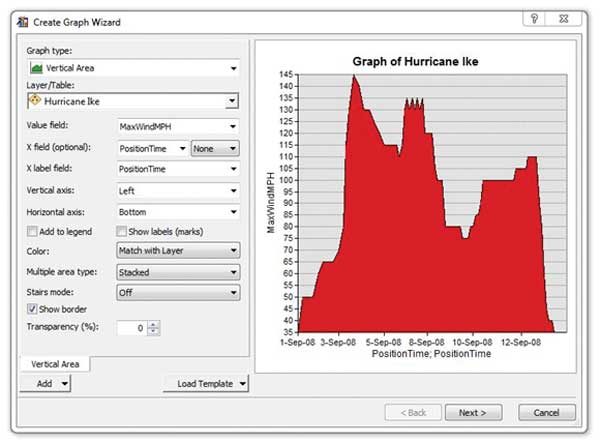
Set basic graph properties in the first wizard panel.
From the map layer's property page, select the Time tab and check the box labeled Enable time on this layer. For Layer Time, specify that the features have a single time. Set Time Field to the field containing the date stamp information, which should be in date/time format.
To view the hurricane positions day by day, set the time step interval to one day. To see the current location of the hurricane, along with all its previous locations, check the box marked Display data cumulatively.
Step 2: Configure the Time Slider Tool
The Time Slider tool is located on the ArcMap Tools toolbar. Open the Time Slider tool, open its property page, and click the Time Extent tab.
Use the Advanced Properties and uncheck automatic scaling.
The full time extent is set to the time extent of the Hurricane Ike map layer. The Start and End times have automatically been set to match the first and last position reported in the map layer. In the example, it is switched to the Time Display tab. Because the position reports are spaced about six hours apart, set the time step interval to six hours and close the Time Slider property page.
Making a Time-Aware Graph
Now that the layer is time aware and the Time Slider tool is configured to display that data, the next step is to make the graph. The graph will inherit the time properties of the layer it's based on, so this step is pretty straightforward.
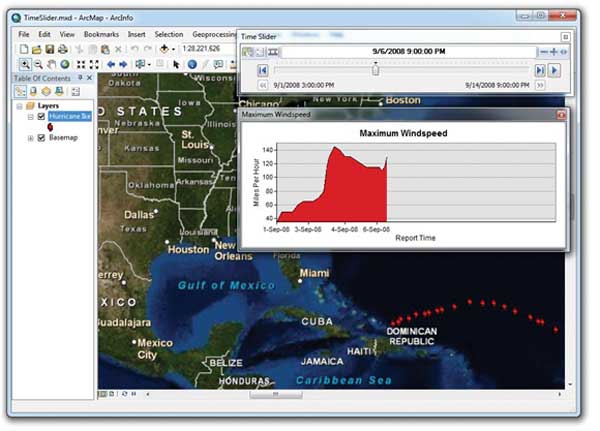
Wind speed as Hurricane Ike approached the Dominican Republic
Step 1: Create the Graph
On the Standard toolbar in ArcMap, choose View > Graphs > Create to start the Graph Wizard.
In the first wizard panel, set some basic properties for the graph. Set the graph type to Vertical Area. Base the graph on the Hurricane Ike map layer and use the MaxWindMPH field from that layer as the Value field. Set the x-axis from the PositionTime field of that layer. Turn off the graph legend, match the graph color to the layer color, and make other cosmetic changes if desired. Click Next.
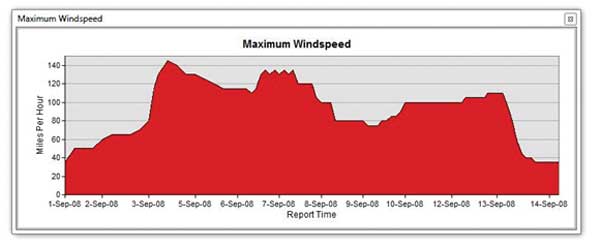
The second wizard panel controls the graph's appearance. Set the graph title to Maximum Windspeed, set the title for the vertical axis to Miles per Hour, and set the title for the bottom axis to Report Time. Click Finish to close the wizard and open the graph.
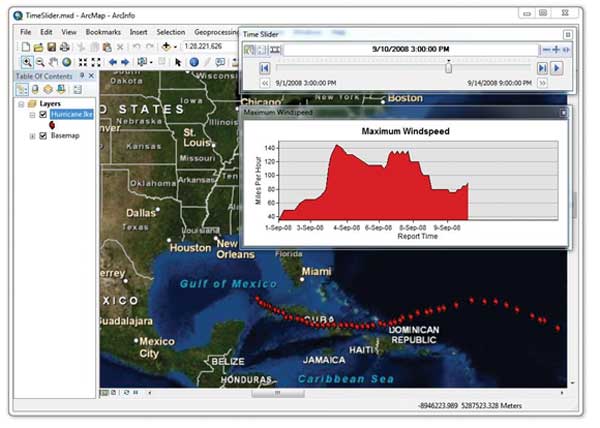
Note the increase in wind speed as the hurricane crosses Cuba.
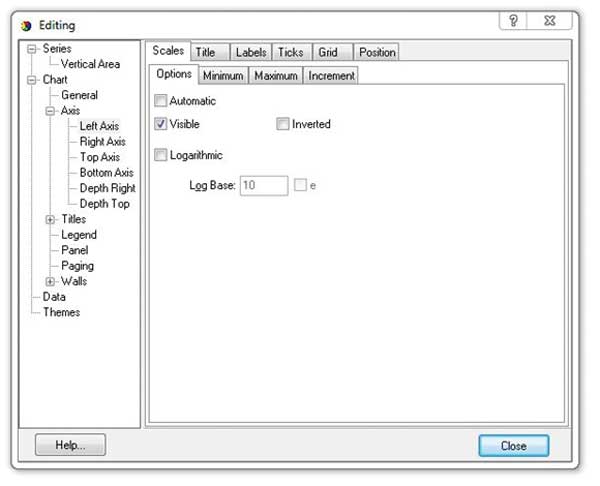
Step 2: Lock the Graph Axes
By default, the horizontal and vertical axes of the graph will rescale to fit the data in response to the Time Slider tool. Both axes' scales need to remain constant, so the next step is to lock them.
Right-click the graph and select Advanced Properties from the context menu. In the Catalog tree, select Left Axis to open its property page. Select the Scales tab, then the Options tab. Disable the automatic scaling for this axis by unchecking the box labeled Automatic.
Click the Minimum tab. Click the Change button and set the value for Minimum Miles Per Hour to zero. Finally, select the Maximum tab and set the upper value for the left axis to 150 Miles per Hour.

Wind speed dropped off once the hurricane began moving across the continential United States.
Follow this procedure to lock the minimum value for the bottom axis to the date and time of the first report and the maximum value to the date and time of the final report on 9/14/2008 at 3:00 p.m. Now the graph display can be manipulated with the Time Slider tool.
Run the Time Slider
Open the Time Slider tool and set it to display the location and wind speed of Hurricane Ike as it approached the Dominican Republic. Modify it to show the wind speed increase as Hurricane Ike crossed over Cuba. Finally, move the Time Slider tool to the time Hurricane Ike made landfall at Houston and began to diminish as it moved onto the continental United States.