ArcUser
Spring 2012 Edition
Preserving a Heritage
Using ArcGIS Explorer for cultural preservation
By Wesley Bernardini, Nate Strout, Alicia Barnash, and Martin Wong, University of Redlands
This article as a PDF.

The Native American groups in the Southwest have an intimate understanding of the horizon. Mountains mark cardinal directions, the residences of deities, or dates on the solar calendar.
A team of archaeologists and GIS programmers at the University of Redlands in California created an add-in for ArcGIS Explorer that delivers archaeological content in an engaging manner and encourages hands-on exploration of the Hopi past by members of the Tribe, especially Hopi youth. Wesley Bernardini, associate professor of sociology and anthropology at the University of Redlands, leads the Spatial Archaeological Research Group (SARG), which includes Nate Strout, Alicia Barnash, and Martin Wong. Bernardini has been collaborating with the Hopi Tribe for 12 years to document and preserve ancestral Hopi sites.
The history of the Hopi Tribe, stretching back centuries before European contact, has been passed on through oral accounts. But when members of the Hopi Cultural Preservation Office noticed that some Hopi youth were more interested in video games than traditional cultural history, they wondered if they might be able to use digital technology to help communicate Hopi history to the next generation. The Tribe asked if SARG could help. Building on University of Redlands expertise in GIS and working closely with the Tribe, the team developed the Hopi Landscape Portal, an ArcGIS Explorer tool that allows Hopi High School students and others to explore Hopi history in a virtual 3D environment.
Analyzing the Southwestern Landscape
The Hopi Landscape Portal provides interactive access to data about ancestral Hopi villages and prominent places on the landscape that were visible from those villages. This digital interface helps students appreciate how ancestral Hopi groups were distributed across the landscape, how they migrated over time to form the Hopi Tribe, and how these movements affected their visual relationship to the landscape.
The Native American groups that call the Southwest home have an intimate understanding of the horizon. Mountains mark cardinal directions, the residences of deities, or dates on the solar calendar. Consequently, underlying the Hopi Landscape Portal Add-in is a large-scale line-of-sight analysis that enables the team to reconstruct spatial and visual relationships among culturally significant places.
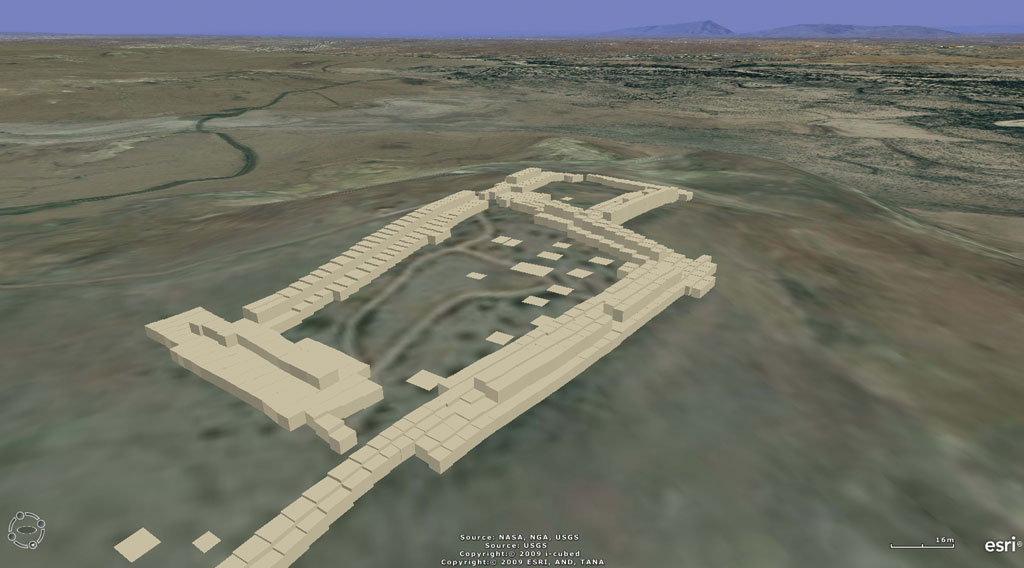
A 3D model of extruded polygons representing the layout of an ancient Southwestern village
The Tribe emphasized that it did not want the Landscape Portal to take the place of traditional cultural history, which is passed on orally through stories and in conversations with relatives. So the team designed the Landscape Portal to make it easy for students to discover new or unfamiliar ancestral places, but the portal does not provide encyclopedic information about those locations. Instead, the Landscape Portal helps students discover spatial relationships between modern and ancient places. Once they have discovered a relationship, Hopi teachers encourage students to seek more information about these places from culturally appropriate sources in their communities.
The portal covers Arizona, Colorado, and New Mexico—the primary area occupied by Puebloan populations, the ancestors of modern Pueblo Tribes. While Hopi ancestors lived and migrated over a larger region, the study area covers the region where most of this activity occurred over the past 900 years.
Choosing a Platform
The team chose ArcGIS Explorer because it is free to download and requires no licensing, so it is easily installed on tribal high school computers. Additional functionality is easily added through Python scripts. Its simple interface with intuitive zooming and panning navigation tools makes it appropriate for classroom situations in which students and instructors may lack previous exposure to GIS software.
For each ancestral Hopi village, the team ran the Skyline tool to generate a polygon defining the edge of the visible world around the village—the horizon. [This analysis was conducted using ArcGIS 10 for Desktop with the 3D Analyst extension.] To identify the specific peaks that make up the horizon, the team first used the Select By Location function to select from a list of US Geological Survey (USGS) peaks within a 1-kilometer buffer zone of the horizon boundary. Next, the Line Of Sight tool was used to assess whether these selected peaks are visible from the village (taking into account the earth's curvature and refraction). Finally, the team used a custom Python script to tabulate statistics for the distance to the peak, the azimuth, and the elevation difference between the summit and the village.
Using the Portal
The Hopi Landscape Portal Add-in opens with a searchable table of 72 publicly accessible ancestral Hopi villages in Arizona, Colorado, and New Mexico. This village table features a Go To button, which zooms to an oblique view of the site, and a Look Toward button, which rotates the view to face the selected location. Users browse an alphabetical list of villages sorted by name or region or choose villages from a particular region by selecting from a drop-down. Villages can also be sorted by the starting or ending date of occupation, a date range (e.g., occupations starting after AD 1250 and ending before AD 1500), or by the number of rooms they contain (a measure of population size).
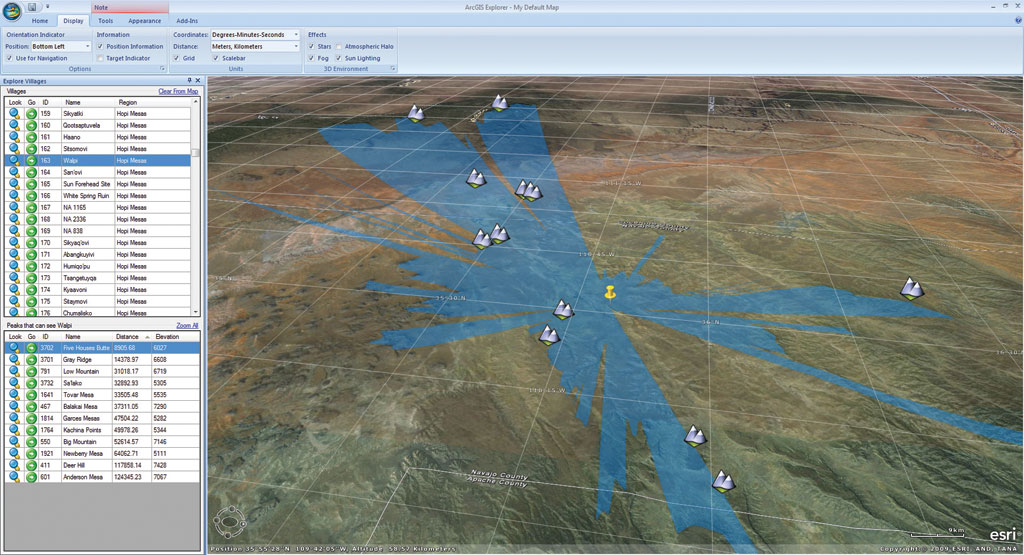
A horizon polygon draped on the landscape
After users choose a village location with the Go To button, they will see a 3D model of extruded polygons representing the layout of the village at its peak occupation. These models were created in ArcMap by digitizing scanned archaeological maps of wall foundations (or, for modern Hopi villages, digitizing polygons over an imagery basemap) and extruding the room polygons in ArcGIS Explorer. When the portal was demonstrated at the Hopi High School, students typically started at their current village, often hunting for their own house in the 3D model.
Once zoomed in to a village, users can right-click the village name to choose Look in a cardinal direction (north, south, east, west) or Add Horizon. The Add Horizon option adds a tinted polygon draped over the landscape representing the edge of the visible world from that point. Once the polygon is turned on, a second right-click of the village name will open Zoom to Horizon, zooming out to an overhead view of the horizon polygon.
Along the edges of the Horizon polygon are mountain icons representing named peaks. Clicking a peak opens a pop-up window with the elevation of the peak, a wireframe sketch of the peak and its neighbors as viewed from the village, and photographs of the peak (if available). Although the database contains more than 20,000 peaks and 1,200 archaeological sites, the locations of most of these sites must be protected to prevent looters from gaining access to them. Consequently, the final version of the portal contains the locations of the pueblos that are in the public domain.
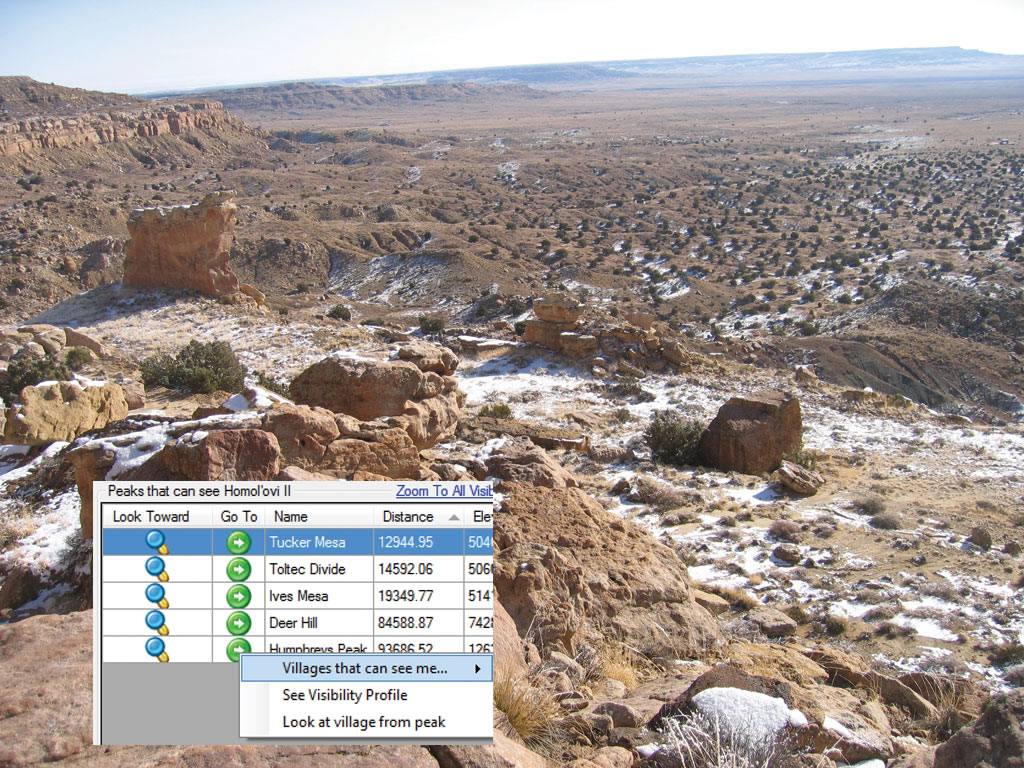
Query results returning a list of all villages that can see the selected peak.
When the user zooms to a village, a second table interface opens a table listing all the peaks on the horizon of the selected village. This list is generated on the fly from a master table of line-of-sight visibility underlying the add-in. The peaks table includes the same Go To and Look Toward buttons and allows the user to zoom to or look in the direction of a selected peak. These horizon peaks can be sorted by distance from the village, azimuth, elevation above sea level, or the difference in elevation between the summit and the village itself. This table also includes a button that zooms to all visible peaks by providing an aerial view encompassing all the horizon peaks for the village.
From the peaks table, users can right-click a peak's name to open several additional functions. The Look at village from peak function spins the view to face the selected village. The See Visibility Profile function opens a pop-up window with a wireframe profile of the topography between the village and the selected peak. (This profile was generated using the www.heywhatsthat.com website.) Finally, a dynamic search window can be opened by right-clicking a peak to open the Villages that can see me function.
The Villages that can see me function opens a new window listing all the villages with line-of-sight visibility to the selected peak and can be sorted by name, region, date of occupation, distance, and number of rooms. Users can explore village-to-peak visual connections along many different axes. For example, users can search for contemporary villages that share a view to a culturally significant peak or 500-year-old villages that shared the same view or the largest (or most distant) village with a common view.
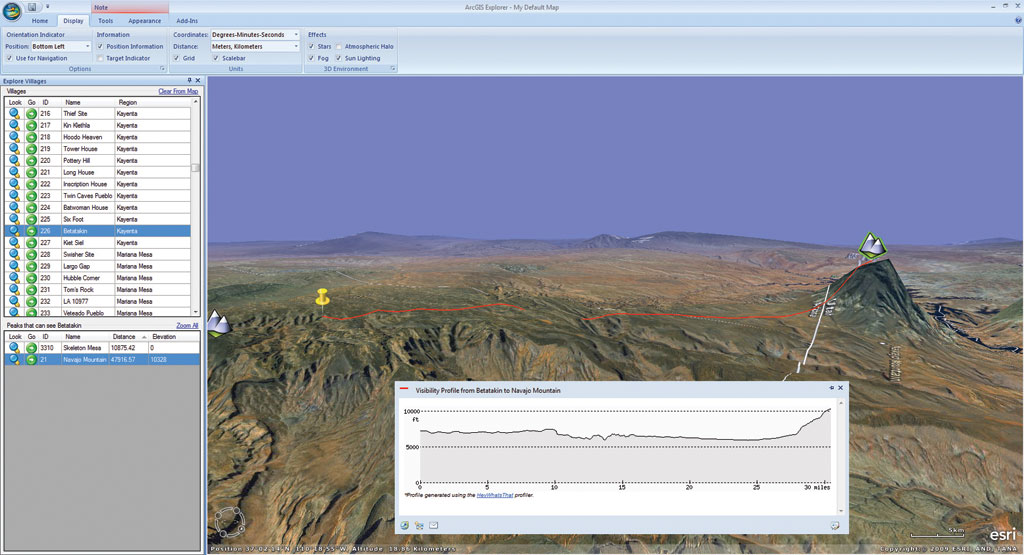
Wireframe topographic profile between the selected village and peak
With this step, students—who began exploring the landscape with their own village—begin discovering unfamiliar cultural places. The relationship between the familiar and unfamiliar places is built on tangible, sensory data ("I can see that from my house!") so the discovery process is intuitive and exciting.
Beyond the Classroom
Because ArcGIS Explorer makes it easy to link images, text, and audio and video files to a point, the Hopi Landscape Portal Add-in can also serve as a common workspace for student assignments. In one lesson plan under development, students would be assigned the task of collecting information about a place in the Landscape Portal. They could do this by visiting and photographing the site or recording an interview with a community member on tablet computers that can be checked out from the classroom and then linking that information to a point on the map.
Students could compile and store cultural information about the landscape. Information collected by students could eventually be added to information about which Hopi clans lived in each ancestral Hopi village. Clan identity is an important part of Hopi life. Hopi history is told primarily through the migrations of particular clans, so it would be useful to query the portal to identify sites affiliated with specific clans. The Hopi Cultural Preservation Office is also considering the Landscape Portal as a way of digitally curating valuable cultural information in a format that promotes easy retrieval and editing.
GIS for Tribal Applications
Many tribes are embracing GIS as a tool for collecting, storing, and analyzing information about traditional cultural places. GIS can also function as an educational tool for interactive exploration of spatial data if the interface is user-friendly and has a shallow learning curve. The team wanted students and instructors to focus their energies on exploring the spatial data rather than learning how to use software. As this example illustrates, ArcGIS Explorer provides a perfect vehicle for designing and delivering interactive educational tools for classroom use.
For more information, contact Dr. Wesley Bernardini, associate professor, department of sociology and anthropology, University of Redlands, at Wesley_bernardini@redlands.edu.
About the Authors

Wesley Bernardini
Wesley Bernardini chairs the department of sociology and anthropology at the University of Redlands in California, where he teaches archaeology and spatial approaches to the study of human behavior. He has collaborated with the Hopi Tribe for more than a decade to reconstruct Hopi history.
Nathan Strout, technology manager of the Redlands Institute, specializes in Python programming and 3D visualization.
Alicia Barnash holds a master's degree in geographic information systems from the University of Redlands and is currently a GIS analyst at the National Center for Environmental Assessment in Washington, DC.
Martin Wong, a GIS technician at the Redlands Institute, specializes in geodatabase design and management.