ArcUser
Spring 2012 Edition
Seeing Beyond the Data
Developing understanding
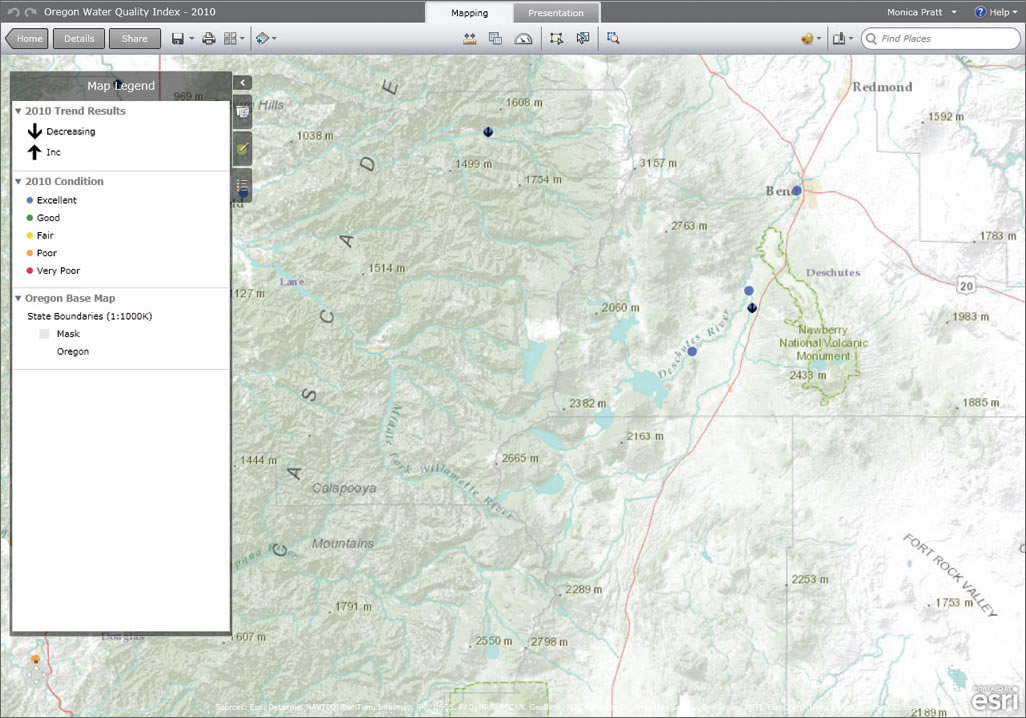
This map, shared on ArcGIS Online, was created by Lesley Merrick of the Department of Environmental Quality to show the status and trends for 131 water quality monitoring stations in Oregon based on a 10-year period from 10/1/1990 to 9/30/2010.
This article as a PDF.
As Esri president Jack Dangermond has observed, "Understanding our world isn't just an 'environmental' issue." Our stewardship of the earth and its resources profoundly affects nearly every aspect of our lives and will affect the lives of future generations. Understanding the earth's systems and its current condition is the foundation for science-based decisions that maximize positive effects and minimize negative ones.
Although individual government agencies and research groups have been gathering data on environmental systems for decades, this data was most often gathered for specific purposes and managed separately to meet organizational needs for regulation and reporting rather than the broader goal of gaining an overall understanding of complex systems.
With the coevolution of measurement technologies and the Internet, the volume of data collected about the natural world has increased exponentially. What was once a data stream has been transformed into a tidal wave of sensor, tabular, satellite, crowdsourced, model, and digitized historic record data. With such a wealth of data, more readily obtainable because of the Internet, it would seem that the understanding of these systems would have increased commensurately.
However, that has not necessarily been the case. Understanding requires more than amassing data. Beyond just obtaining data, understanding demands the organization and synthesis of that data, producing information from which conclusions and predictions can be derived. This understanding provides a scientific basis for taking action or modifying behavior.
GIS aids in understanding earth systems by providing a platform for evaluating, managing, and integrating data in a geographic framework. The coevolution of GIS with other IT technologies has extended its reach from the desktop to the server, mobile devices, and the Cloud.
Always able to incorporate a broad spectrum of data types and formats, GIS data integration capabilities have continually expanded, so much so that GIS is the enabling platform for managing, using, and visualizing the outputs from other types of analysis software.
ArcGIS has also become a comprehensive platform for managing imagery and raster format data and making the wealth of information contained in that data format more immediately and widely accessible. Users can interact with imagery directly, through dynamic services, or through static (cached) services. These capabilities are especially valuable for natural resources applications. Historically, imagery has played an important role in environmental studies owing to the scale and frequency at which it is collected.
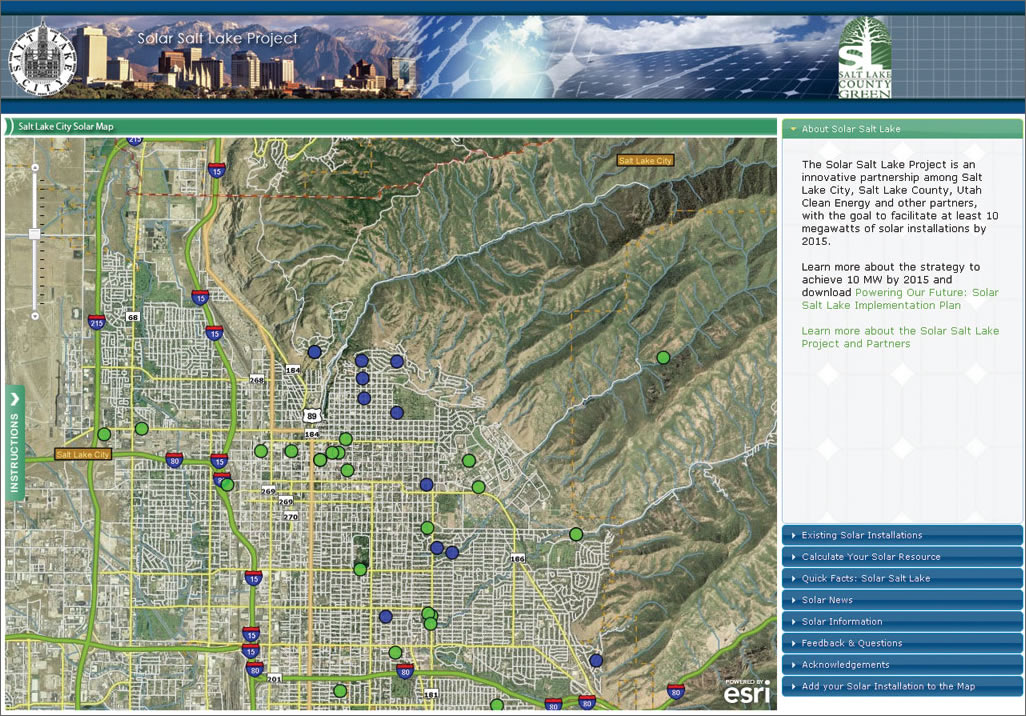
The Solar Salt Lake Project, a joint effort of Salt Lake City, Salt Lake County, Utah Clean Energy, and other partners, has developed this interactive mapping app for assessing solar potential of sites to help reach the goal of producing at least 10 megawatts from solar installations by 2015.
Hundreds of geoprocessing tools are available in ArcGIS for integrating, analyzing, and managing expansive datasets of all types. Custom geoprocessing tools can also be created using the popular scripting language Python. Geoprocessing tools are available on the desktop or can be accessed through web clients as services that run on ArcGIS for Server.
ModelBuilder, a graphic modeling framework for designing and implementing geoprocessing models that incorporate tools, scripts, and data, can automate workflows that would be prohibitively time-consuming to execute manually. Models also make processes repeatable and documented.
Intelligent web maps incorporate the results of data integration and analysis and are an efficient mechanism for sharing information. Using ArcGIS Online, Esri's cloud-based, collaborative content management system for maps, apps, data, and other services, information in maps and apps can be made available to a group of collaborators or the public. ArcGIS Online makes thousands of maps, including topographic, imagery, terrain, street, and ocean basemaps, available to anyone at no charge. These maps can be viewed and new maps created using an online map viewer or ArcGIS Explorer Online.
The articles in the Focus section of this issue demonstrate how geoprocessing tools, models, maps, and web apps have been applied to better understand the natural environment and the effects of human activities on it and manage and safeguard natural resources.
Regional management of natural resources can be especially challenging because the effects of human activities don't stop neatly at political boundaries. The Regional Water Management Board in Poland and the Slovak Water Management Enterprise in Slovakia built a GIS that provides a common database and platform for managing surface and groundwater in a 2,600-square-mile transboundary area shared by both countries. This ambitious system furnishes tools and data to three classes of users: government entities in both countries that make water policy; institutions, local governments, and other major water users; and businesses, other nongovernmental groups, and the public.
Although solar and other renewable methods of energy generation are desirable, their implementation can have adverse effects on plant and animal life. Improvements in GIS tools and the availability of spatial data on a regional scale enabled scientists at the Argonne National Laboratory to assess the impacts of commercial utility-scale solar energy development on Bureau of Land Management-administered land in six southwestern states covering approximately 677,000 acres. Employing ModelBuilder and custom Python scripts, 1,000 habitat models were processed without additional user input. If these analyses were run manually, processing just 425 of these raster models would have taken 32 man-hours, but using a script, it was accomplished in just 15 minutes on a typical Windows machine.
In some cases, the challenge is not the scope of a project but the need to convince individuals to modify their activities. By analyzing existing datasets collected by various state and federal agencies in the United States, researchers were able to identify areas in South Carolina where farmers' agricultural practices were causing watershed degradation. Based on these analyses, Research Planning, Inc., working under a grant from the South Carolina Department of Health and Environmental Control, conducted outreach programs that resulted in remediation of slightly less than 2,000 acres of watershed.
In each instance, GIS has enabled greater understanding of natural systems by abstracting aspects of the world into knowledge objects—data, imagery, models, and maps—that form a systematic framework for a collective understanding that is the basis for intelligent action. This is the understanding necessary to more wisely use natural resources and protect the earth systems on which the well-being of seven billion people depend.