ArcUser Online
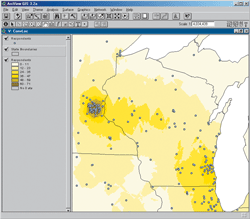
Like many colleges and universities, the University of Wisconsin (UW) System surveys potential students to learn about their college expectations and their preferences for specific academic programs. GIS is not the first thing that typically comes to mind when people think of designing and analyzing mail surveys, but it has become a valuable tool for the UW System Market Research Unit, which provides survey research to four-year and two-year colleges within the UW System. Understanding the PopulationSurveying potential students can be more difficult than surveying current students. Typically, less is known about potential students beforehand. Mailing lists come from outside sources rather than campus records. Consequently, a survey of potential students runs a greater risk of asking the wrong questions than a survey of current students. Through experience, the UW System Market Research Unit has learned that mapping a mailing list is a quick and easy way to uncover errors in a list and gain insights into the population being surveyed. For example, one of the smaller schools in the University of Wisconsin System acquired a mailing list from an academic testing organization with the intention of assessing the school's image among college-bound high school students. A map of the mailing list revealed that the list included many out-of-state students. These students were poor targets for an image study since they knew little about the school. In another case, a school in the UW System surveyed health care employees about their interest in a master's degree. These working professionals, who lived in the major metropolitan areas of Wisconsin and Minnesota, showed little interest in commuting to a rural UW campus. Had the geography of this population been noted beforehand, the lack of interest in the program might have been anticipated. The health care professionals could have been asked about their interest in distance education or their perceptions of competing programs closer to their homes. This approach would have resulted in more useful information for the school. Regional DifferencesMapping a mailing list can be helpful in understanding a survey population, but GIS also can contribute to the analysis of survey responses. When it is important to ensure that a survey is geographically representative, GIS can be used to define geographic regions for sample stratification or for post hoc weighting of responses. The System Market Research Unit routinely uses GIS to ensure that survey responses match the geographic distribution of the population. When accessing awareness or perception of a college, GIS can be used to analyze regional differences among survey respondents. One UW school wanted to understand why some incoming freshmen cancelled their admission and decided not to attend. The college suspected these students did not want to live in the town where the college is located. To verify or disprove this theory, these students were asked to rate the importance of characteristics, such as the presence of shops and restaurants within walking distance of campus, and how well these characteristics described the town where the UW school is located. On average, the news was good. Students from most parts of the state were satisfied with the town, but those from one region felt the town was lacking in qualities important to the college experience. Knowing how the town's image differed across the state could guide the college's communication strategies with potential students from those areas. Commuting PreferencesFor nontraditional students—those who work full time and live off campus—the school's location may be a determining factor. Analyzing a few simple survey questions with GIS can reveal which locations potential students will find more convenient. In one project, a consortium of schools in the Upper Midwest planned to offer a health sciences program over the Internet. However, the program's laboratory work needed to be taught face-to-face. What were the best locations for holding these labs? A survey described the program to potential students and asked how far they would be willing to commute to attend labs. The distance specified, as measured from each respondent's ZIP Code, became the preferred commuting area for that respondent. Overlaying the commuting areas revealed which locations were convenient for the greatest number of respondents. The result: a clearer picture of which schools in the consortium would be the most accessible sites for laboratory classes. Using GIS in the design and analysis of surveys is not the flashiest application of GIS, but it is an excellent example of how mapping and geoprocessing can contribute to research areas not normally thought of as geographic. Higher education administrators, as well as market researchers in other fields, should take advantage of GIS capabilities. For more information, contact David Blough |
