ArcUser Online
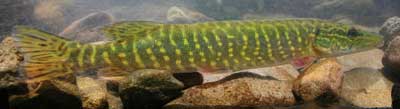
Lake Davis is a large reservoir located in the Sierra Nevada mountains about 90 miles northwest of Lake Tahoe. Pike were illegally introduced to Lake Davis and nearby Frenchman Reservoir and Sierra Valley streams. In the early 1990s, DFG successfully eradicated pike from Frenchman Reservoir and Sierra Valley streams. In 1997, a treatment using a piscicide [a chemical poisonous to fish] appeared to have successfully eradicated pike from Lake Davis. However, pike were rediscovered in 1999. It is not known whether some pike survived the 1997 treatment or were illegally reintroduced to the reservoir. The saga of Lake Davis has been a high profile and controversial issue. Since 1999, DFG has tried to control and contain pike in Lake Davis using many techniques including trapping, electrofishing, and even explosives. Although more than 66,000 pike were removed between 2000 and 2007, the pike population continued to grow and spread further upstream into tributaries. If pike escape or are moved from the reservoir and become established in other waters, they could endanger other fish populations. Pike could negatively and irreversibly impact portions of the Sacramento-San Joaquin Delta, Feather, Sacramento, and San Joaquin river systems and other waters in California.
DFG conducted a joint environmental review process with the U.S. Forest Service in accordance with the California Environmental Quality Act and National Environmental Policy Act. The purpose of the 2007 project was the eradication of pike from Lake Davis and its tributaries in a way that minimized impacts to the environment and local community. After extensive public outreach and input, several pike elimination alternatives were evaluated. DFG determined that treating the reservoir and its tributaries with a rotenone piscicide had the fewest environmental and economic impacts. Rotenone is a naturally occurring compound derived from the roots of a tropical plant in the bean family. A new commercial formulation of rotenone, CFT Legumine, was selected for the 2007 treatment. Rotenone has been approved for fishery management use by the U.S. Environmental Protection Agency and California Department of Pesticide Regulation and is the only group of piscicides registered in California for this use. The project was extensively covered by numerous media sources. Many reporters were on-site to witness treatments. Following the treatment, the reservoir will be restocked so that it will again be the trophy trout fishing destination it was before the introduction of pike. Using GIS and GPS in the Pike Eradication
GIS and GPS were involved from early project planning through implementation and will also be employed for posttreatment monitoring. The project used ArcGIS Desktop (both ArcInfo and ArcView), ArcGIS Explorer, and ArcView 3.x. Three Trimble GeoXM units, 80 new Garmin GPSMAP 60Cx and GPSMAP 76Cx units, and several older Garmin units of various models were used for data collection. The new Garmin units included SiRF high-sensitivity architecture and Wide Area Augmentation System (WAAS) differential capability, which allowed for high-quality data collection even under riparian canopy conditions. GIS and GPS were used on the 2007 project for
Project Area Boundary
The project area boundary was defined using GIS. The 44-square-mile project area included the reservoir and the tributaries leading into it. The California Interagency Watershed Map, a subset of the most current and official California GIS layer for watershed boundaries, was used to represent the project area boundary. Grid Referencing SystemTo geographically organize project resources, a grid of quarter-mile square cells was created to cover the entire project area. Each grid cell had a unique identification number. The grid was used for many spatial referencing aspects of project management including deployment of stream and reservoir treatment crews, chemical treatment calculations, communications, and emergency response. The grid was developed as a vector GIS layer using the ArcInfo Workstation Generate command with the Fishnet subcommand. (This operation can also be accomplished with ArcToolbox using the Create Fishnet tool in the Feature Class toolset in the Data Management tools.) GPS BasemapA project area basemap was developed using GIS shapefiles that were symbolized and loaded into the Garmin GPS units using Garmin's MapSource Product Creator software. The GPS basemap included the same project area boundary, quarter-mile grid referencing system, and background layers (including the U.S. Geological Survey [USGS] High Resolution National Hydrography Dataset and United States Department of Agriculture Forest Service roads) that were used on other project maps. Aerial Surveys
Prior to the treatment, DFG conducted digital aerial photography surveys of the project area at key times to evaluate the water levels and habitat conditions of the reservoir and its tributaries. Rather than using traditional orthorectification procedures, the ArcMap georeferencing toolbar was used to save time by quickly bringing the aerial photographs into register with the rest of the project GIS data. Interactive Map ViewerUsing ArcIMS and DFG's map viewer template, an online interactive Lake Davis map viewer was set up for project staff and the public. [DFG's map viewer template has won awards from the Organization of Fish and Wildlife Information Managers in 2005 and a first place in the Internet Mapping contest at the 2003 Esri International User Conference.] This made it easy to assess the geography of the project area and particular GIS layers of interest using just a Web browser. Map Atlases
Separate reservoir and tributary stream map atlases were produced in hard-copy format and given to field crews ahead of time so they could become familiar with areas they were assigned to treat. ArcView 3.x was used to create the atlases because it can create multiple map layouts from multiple views. The atlases included area overview maps and individual maps for each quarter-mile grid. Many of the maps used digital raster graphic (DRG) topographic maps draped over current aerial photographs. The ArcView 3.x DRG Tools extension obtained from ArcScripts (www.esri.com/arcscripts) was used to isolate particular topographic map features and make the rest of the map transparent so that the aerial photographs could be seen underneath. In the stream map atlases, the aerial photographs were printed on regular paper, and the topographic map features were printed on transparent overlays. This approach allowed the stream field crews to clearly view the aerial photographs by themselves or in combination with the topographic map features. Field Surveys and NavigationFor several years prior to the 2007 project, GPS units were used by stream field crews to survey their assigned areas and map existing and potential locations (wet areas) to be revisited for treatment. During the treatment phase, GPS was used by field staff for navigation to assigned treatment areas and by emergency medical technicians, fish disposal crews, and other project staff for general locational reference. Particularly sensitive habitat areas along with potential habitat for threatened species were also identified using GPS and flagged in the field so that they would not be disturbed. Bathymetric Data Analysis
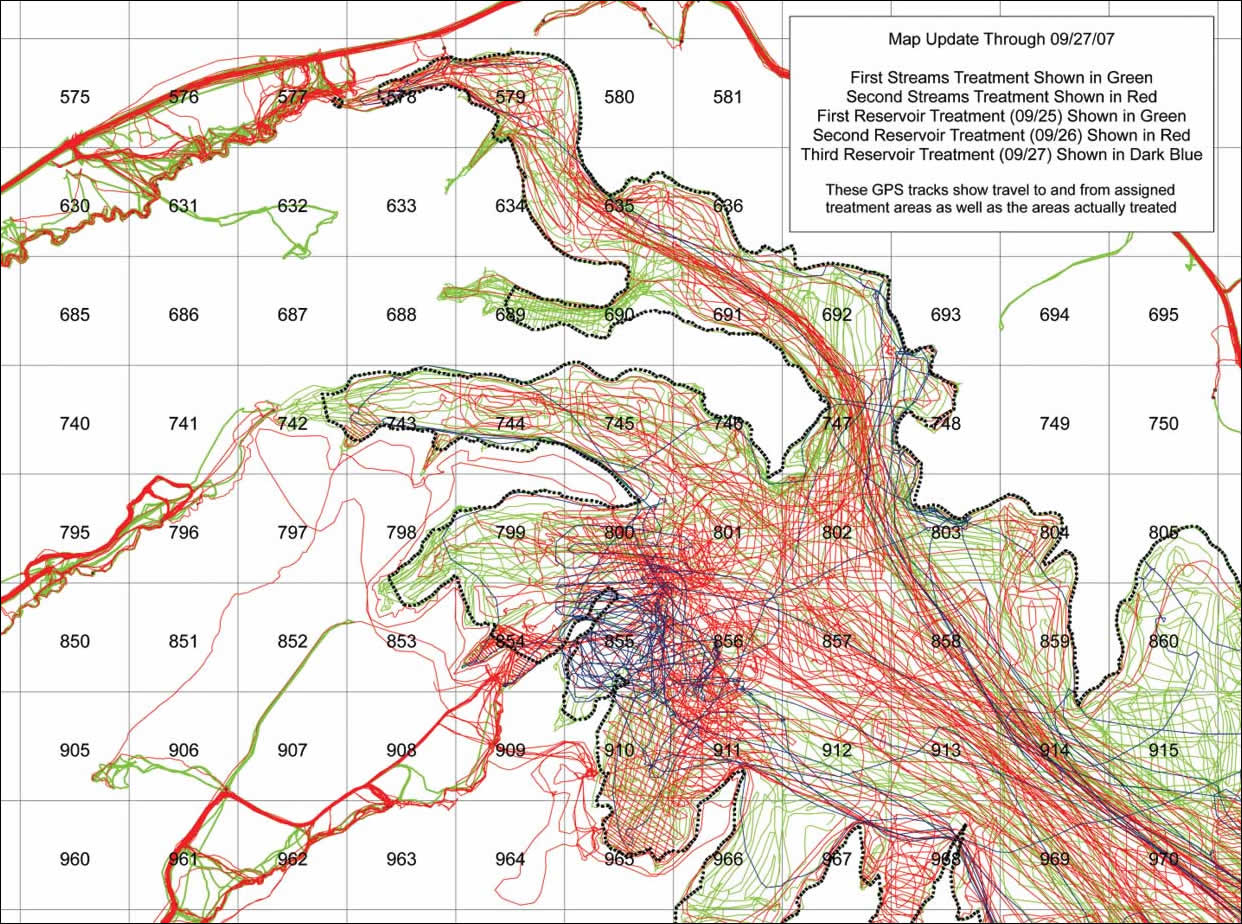
Bathymetric (water depth) contour data for Lake Davis was provided by the California Department of Water Resources (DWR) in CAD format. Using various geoprocessing techniques, DFG GIS staff produced derivative GIS products from the CAD data including bathymetric triangulated irregular networks (TINs), digital elevation models (DEMs), and hillshades. These derivative products were used to help calculate the amount of rotenone needed for the reservoir treatment, including specific amounts to be applied within each quarter-mile grid. Supplemented with daily reservoir-level information provided by DWR's California Data Exchange Center, the bathymetric data was also used to create a GIS layer that estimated the reservoir shoreline location at the time of treatment. While the reservoir has a capacity of about 84,400 acre feet, the storage was around 41,800 acre feet during the treatment. Treatment Status MapsDuring the chemical treatments, stream and reservoir treatment teams carried GPS units that recorded daily travels as track logs. At the end of each day, the teams turned in their GPS units for processing. GIS staff downloaded the track logs from the units and converted them to shapefiles using DNR Garmin software (developed by the Minnesota Department of Natural Resources [DNR]). Using ArcMap and ArcGIS Explorer, status maps were produced using the GPS track log shapefiles to show how the treatment was progressing. Project managers used the maps to determine if all target areas had been visited and to adjust the deployment of treatment crews as necessary. ConclusionGIS and GPS proved to be powerful tools critical to the successful implementation of a project of this scope and complexity. GIS provided the means to create needed map-reference products and facilitate geographic analyses. GPS provided necessary tools for surveys, navigation, and tracking. Both technologies were utilized to produce status maps that were invaluable in conducting the 2007 treatment. For more information, visit the Lake Davis Pike Eradication Project Web site at www.dfg.ca.gov/lakedavis/ or the DFG Web site at www.dfg.ca.gov or contact Will Patterson at wpatters@dfg.ca.gov or geodata@dfg.ca.gov or Ken DeVore at kdevore@dfg.ca.gov. About the AuthorsWill Patterson is a GIS specialist for DFG's Biogeographic Data Branch in Sacramento. He has a bachelor's degree in geography and economics from the University of California, Davis, a certificate of study in GIS and remote sensing from Humboldt State University, and a master's degree in natural resources also from Humboldt State University. He is a former Esri User Conference student assistant. Ken DeVore is a GIS specialist for DFG's South Coast Region in San Diego. He has a bachelor's degree in anthropology from California State University, Stanislaus, and a master's degree in planning from the University of Southern California. DeVore was the GIS team leader for the Lake Davis Pike Eradication Project. AcknowledgmentsThe authors thank Greg Ewing, Lora Konde, and Isaac Oshima for their generous GIS and GPS assistance on this project. Thanks also go to the project management for assistance with this article and the project field teams for incorporating GIS and GPS into their work. |