Choosing a Scenic Byway Using Spatial Criteria
An exercise in planning with GIS
By Joseph Kerski, Esri Education Manager
This article as a PDF .
Editor's note: This exercise assumes a working knowledge of ArcGIS Desktop and is intended for intermediate GIS users, university or community college students, and experienced secondary students. It uses ArcGIS Desktop to examine current byways and select a new byway based on specific spatial criteria and ArcGIS Explorer to visualize existing and planned byways.
All of us have probably enjoyed traveling on a scenic byway at one time in our lives. What makes this route especially memorable? Have you ever thought about the qualities that are used in determining the criteria to designate a state or national scenic byway?
Because these criteria are inherently geographic in nature, planning a scenic byway is routinely done with the help of GIS. These plans represent an interesting mix of objective and subjective considerations. Consequently, choosing scenic byways can make an excellent instructional activity using GIS because it combines inquiry, technology, and multiple disciplines in a decision-making environment.
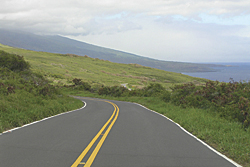 |
| One of the author's favorite byways: This road hugs the south side of Haleakala Volcano on the island of Maui. |
A new lesson in the ArcLessons library, Planning a Scenic Byway in Colorado, places you in the role of the State Scenic Byways program coordinator (an actual job position). As the coordinator, you will consider the criteria used by the National Scenic Byways Nominations Guide. "Scenic" is only one of six criteria used by the guide; others consider natural, historic, cultural, archaeological, and recreational qualities. You must choose between four roadways. To do this, you will use a variety of data, including traffic patterns, terrain, rivers, and population centers along with a weighting system, to choose the roadway that best meets all the criteria. You will consider federal land and terrain; using ArcGIS Desktop and ArcGIS Explorer to view the area in 2D and 3D will help you make your decision. GIS skills developed in this lesson include spatial and attribute querying, weighting, symbolizing, layouts, and the use of GIS to make an informed decision.
In late 2009, the State of Colorado posted a job opening for a State Scenic Byways program coordinator at the Colorado Department of Transportation (CDOT) headquarters in Denver. Here is the position description:
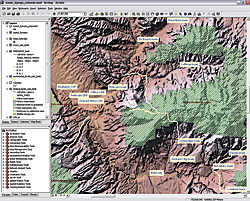 |
| The ArcMap document in the sample dataset contains layers showing federal lands, political boundaries, cities, topography, and existing and proposed scenic byways. |
This position serves as the statewide Staff Authority on the scenic and historic byways program. It directs the program by formulating policy for approval by the Governor's Scenic and Historic Byways Commission; serves as a resource to local agencies, communities, and byway organizations statewide; develops and implements planning and marketing strategies for the byway program; writes grant proposals for public and private funds; administers and supervises federal grant contracts; and interprets federal and state requirements. This position exists to work with CDOT staff; FHWA; and resource agencies such as the Colorado Department of Tourism, Bureau of Land Management, Colorado Historical Society, and others, to implement strategies for directing federal funding to Colorado.
After reading this description, what do you think would be the most challenging part of the job, and why? Let's say you decide to apply for this job position, and based on your experience with GIS, CDOT decides to offer you the job. Your first task on the job is to learn all you can about the existing state scenic byways. You do this by examining a Colorado scenic map supplied by MilebyMile.com (www.milebymile.com/maps/Colorado_road_map.pdf).
- Go to the location where you downloaded and unzipped the data and lesson from the sample dataset archive.
- Start ArcMap and open the scenic_byways_colorado.mxd map document. What do you notice about the pattern of scenic byways in Colorado? What types of federal lands seem to have the most scenic byways? Why?
- Open up the attribute table of the scenic byways map layer and sort on Length. The values in the Length field are in meters. What is the total length of scenic byways in Colorado? Use the Statistics tool and give your answer in kilometers.
- Describe the location of the five longest scenic byways in Colorado listing the towns along the route. Give the length of each byway in kilometers.
| Description | Location | Towns Connected | Length (km) |
| 1 | | | |
| 2 | | | |
| 3 | | | |
| 4 | | | |
| 5 | | | |
Table 1: Information on the five longest byways
- How many of the five longest scenic byways in Colorado are on the Great Plains, or in the mountains?
- How many are along interstate, U.S., or state highways?
- Why do you think these differences exist?
- How many scenic byways are in urban centers, and how many cross the Continental Divide?
- Choose three scenic byway segments in the attribute table. Find these three segments, or ones nearby, in the highways attribute table. Examine the Average Annual Daily Traffic (AADT), which is the average number of vehicles traveling on these roads each day.
- What is the AADT of your three chosen segments? Sort on AADT and choose the three most-traveled segments of highway in Colorado.
- What is the AADT of these segments? Zoom to each.
- Do the locations of these well-traveled roads make sense?
- What is the AADT on the least-trafficked road segment in Colorado, and where is it?
- Symbolize the highway segments based on the AADT field values. Use thicker lines for more heavily traveled roads. Describe the pattern of highway use in Colorado. Interstate highways are the most major roadways, followed by U.S. highways, then state highways; these designations are in the field
ROUTESIGN. Which type of highway experiences the most traffic in Colorado, and why?
- Summarize AADT by ROUTESIGN and indicate the average AADT on each type in Table 2.
| Type of Highway | Average AADT |
| Interstate | |
| U.S. | |
| State | |
Table 2: Average Annual Daily Traffic (AADT) for three selected segments
- On the Colorado Scenic Byways site (www.coloradobyways.org/Main.cfm), choose your two favorite byways. Describe where they are located, and explain why they are your favorites. Save your map document in an appropriate location.
Proposing a New Scenic Byway
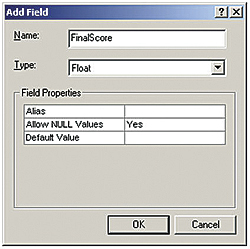 |
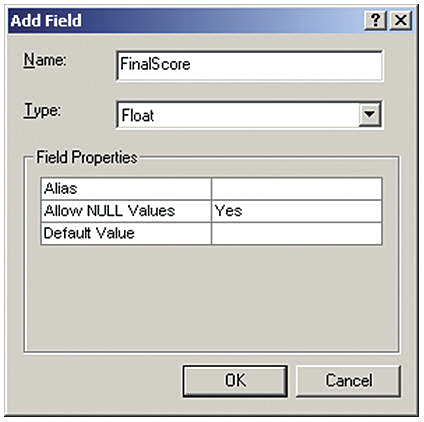
| In the scenic byways attribute table, add a field named FinalScore and set its type to Float. Also set |
This year, the state and citizens of Colorado want you to propose one additional road as a scenic byway. Four road segments have been submitted for your consideration. To help you make your decision, you first examine the National Scenic Byways Nominations Guide, which has been included in the sample dataset you downloaded from ArcUser Online. This guide lists six intrinsic qualities as essential components used in designating a highway as a byway: scenic, natural, historic, cultural, archaeological, and recreational. For the purposes of the National Scenic Byways Program, these qualities are defined as shown in the sidebar entitled "Scenic Byways Qualities."
Weighing Qualities
Which of these six qualities seems most important to you? Least? Why?
- Examine your scenic_byways_proposed map layer. The six qualities have been assessed and applied to four different road segments in Colorado that are contained in this layer: Proposed Byway 1 is in west central Colorado, along State Highway 139 between Loma and Rangely. Proposed Byway 2 is in north central Colorado, along State Highway 9, U.S. Highway 40, and State Highways 14 and 125 from Silverthorne to Kremmling, to Walden, and north to the Wyoming border. Proposed Byway 3 is in east central Colorado along U.S. Highway 36 from Byers east to the Kansas border. Proposed Byway 4 is in southeast Colorado along U.S. Highway 160 from Trinidad east to the Kansas border.
- Fill in Table 3 to indicate how the six qualities were assessed for each proposed byway.
| Byway No. | Scenic | Natural | Historic | Cultural | Archaeological | Recreational |
| Byway 1 | | | | | | |
| Byway 2 | | | | | | |
| Byway 3 | | | | | | |
| Byway 4 | | | | | | |
Table 3: Quality assessments for proposed byways
These quality assessment values are based on a 1�10 scale with 10 reflecting the highest quality so the byway with the highest score is the one you will select. For example, a byway with ratings of 7, 4, 3, 5, 9, and 1 would have a final score of 29. If you chose the byway based on the highest total score (with all qualities given equal weight), which byway would be chosen?
- Conduct some research on these four routes. For example, Byway 4 traverses the Comanche National Grassland. This area covers over 435,000 acres of grassland that has a rich history. It has been home to dinosaurs, the Comanche Indian Tribe, cattle ranchers, and the U.S. Forest Service and encompasses the Cimarron Cutoff of the Santa Fe Trail and natural wonders including more than 257 species of birds, such as Say's phoebes, rock wrens, western meadowlarks, mourning doves, and redheaded woodpeckers. At Picketwire Canyonlands, more than 1,300 dinosaur tracks can be viewed. Prehistoric rock art, early homesteaders' rock huts, and limestone markers can also be seen. Write a paragraph about each of the four proposed byway routes, including as many of the six byway qualities as you can in each paragraph.
Based on your research, you feel that the byways should not be equally weighted but be weighted as shown in Table 4.
| Quality | Factor |
| Scenic | 1.5 |
| Historic | 3.0 |
| Cultural | 1.5 |
| Archaeological | 0.5 |
| Recreational | 1.0 |
Table 4: Weighting factors for qualities
To calculate a final score, use this formula:
(Scenic * 1.5) + Natural + (Historic * 3) + (Cultural * 1.5) + (Archaeological * 0.5) + (Recreational * 1.0)
- Open the attribute table for the scenic_byways_proposed layer and add a field. Name it FinalScore, set its type to Float, and set Allow NULL Values to Yes. Why should the FinalScore field be a floating point (i.e., with decimals) type rather than an integer type?
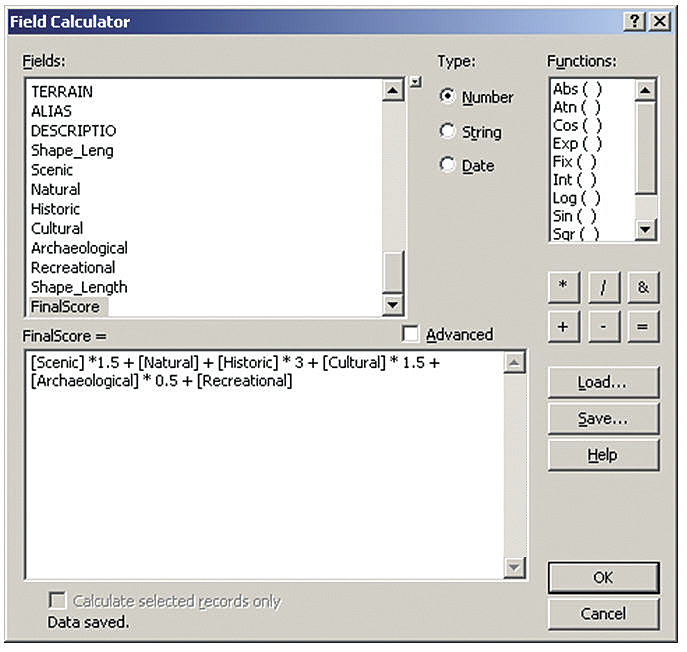
- Go to Options > Clear Selection, then right-click the new FinalScore field > Field Calculator. Calculate the new field using the weighting formula. Select all fields and operators using the mouse rather than typing in the formula box. Alternatively, click the Load button on the Field Calculator and load bywaysfinalscore.cal, the expression that has been saved in the geodatabase. Click OK to populate the FinalScore field with calculated values.
- Which proposed byway received the highest final score, and where is it located? Symbolize the four byways using graduated symbology. Use the values in the FinalScore field to determine the thickness of the lines. What does this new map help you to do? Besides the six quality criteria, consider the amount of federal lands that the roads cross. Because the federal lands were set aside as national forests, grasslands, and national parks, the more federal lands that a proposed bypass crosses, the better candidate it will make.
- To find out the amount of federal lands these roads cross, intersect the proposed bypasses with federal lands and save the output feature class in the geodatabase. Symbolize the proposed bypasses that intersect federal lands using a shade of blue. Which of the four proposed bypasses intersect federal lands?
| Bypass | Length, in kilometers, of bypass that intersects federal lands |
| Bypass 2 | |
| Bypass 4 | |
Table 5: Bypasses that intersect the most federal lands
- To determine which bypasses intersect the most federal lands, access your attribute table for the new intersect layer. Select the segments with a final score of 41 (Bypass 2) using Select By Attribute or by highlighting them with the mouse in the table. Right-click the shape_length field and choose Statistics. Note the length, in meters, of the roadway. Do the same thing for each segment with a final score of 43.5 (Bypass 4) and note its length (also in meters). Fill out the table below and convert length to kilometers. Which bypass would you select based on the criteria of the length of roadway on federal lands?
- Next, weight the less-trafficked bypasses more favorably, because you consider a large number of vehicles antithetical to the whole notion of a scenic byway. As you did earlier, select the four different byways by their FINALSCORE, one by one, summarizing on AADT, entering the mean AADT for each bypass in Table 6.
| Bypass | Mean AADT |
| Bypass 1 | |
| Bypass 2 | |
| Bypass 3 | |
| Bypass 4 | |
Table 6: Mean Average Annual Daily Traffic (AADT) for bypasses
Based on these numbers and your preference, which bypass should be selected? Could a busier roadway be considered more worthy of being designated a scenic byway? How? Following are a few analyses:
River Analysis
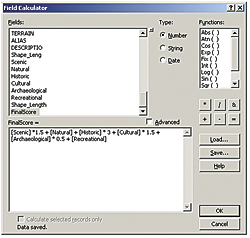 |
| Calculate the new field using the weighting formula. Select all fields and operators using the mouse rather than typing in the formula box, or cut and paste the expression that has been saved as bywaysfinalscore.cal in the geodatabase. |
Turn on the rivers layer. Which of the four proposed bypasses seems to cross or follow the most rivers? What are the differences between rivers on eastern plains versus rivers in the mountains? How do rivers impact the scenery, and does considering rivers change the bypass that you most want to select? Why or why not?
Urban Areas Analysis
Turn on the cities layer. Which of the four proposed bypasses seems to be nearest cities? Symbolize the cities as graduated symbols based on the attribute Pop100. Which of the four proposed bypasses is nearest major cities? Does considering city locations and sizes change the bypass that you most want to select? Why or why not?
Terrain Analysis
Turn on the shaded relief layer. Which of the four bypasses traverses the most varied terrain and the flattest terrain? Does a consideration of the relief of the landscape as shown on the shaded relief layer change your judgment on which bypass should be selected? Why or why not?
Looking at Data in 2D and 3D
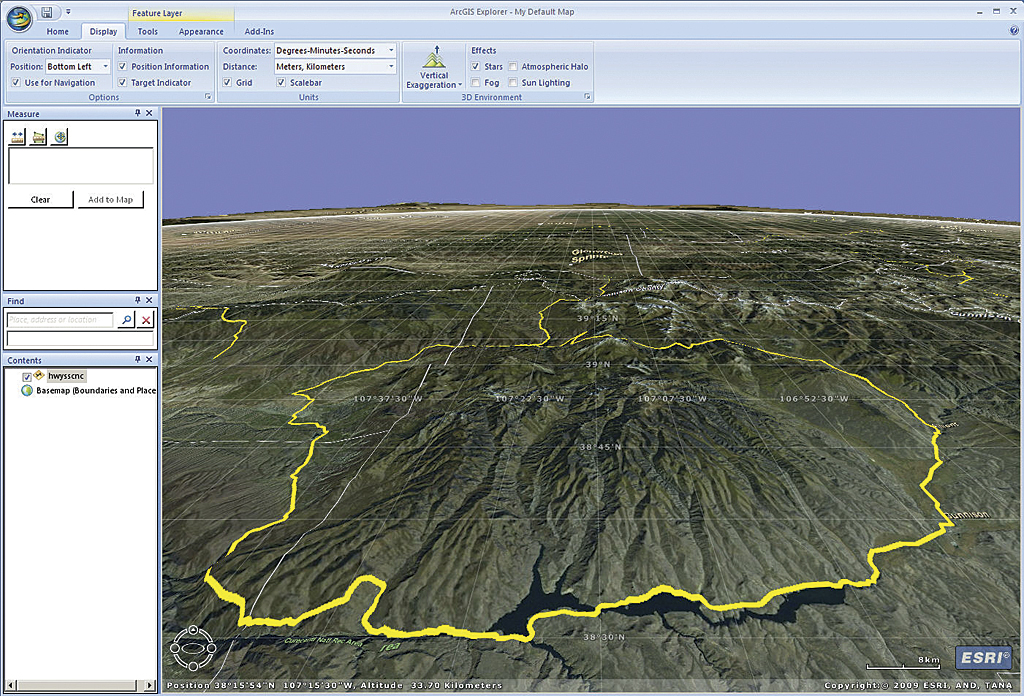
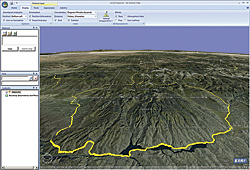 |
| Add the feature classes to ArcGIS Explorer to see if viewing the data in 3D changes your choice of byway. |
- Start ArcGIS Explorer and add the feature classes for existing and proposed scenic bypasses from your geodatabase. Does the 3D capability of ArcGIS Explorer change your answer to the previous questions in terms of which bypass is on the steepest or flattest terrain? Do you consider steep or flat terrain to be more scenic? Does the 3D perspective change your mind in terms of the bypass you most favor? Why or why not?
- In ArcMap, create a layout that contains a title, north arrow, name, scale bar, legend, the selected bypass in a different color than the other byways, and any other information that you feel is necessary. How did the weights that you assigned to each of the six quality criteria affect the final score?
- Rerun the calculations with your own weights. How did you weight the criteria, and why?
- Give a presentation about what you have learned about scenic byways, how byways are selected, and how the spatial perspective and GIS enhanced your decision-making process.
Conclusion
In this exercise, you used spatial analysis techniques and data from a variety of sources to consider several criteria, weight them, and make a better decision. For additional exercises and instructional materials, visit www.esri.com/arclessons.
|