Image data--It used to be a precious commodity, but now it's everywhere. New technologies have taken
us from aerial photographs to satellite imagery. Now remote sensing systems can capture and process
digital data within hours so it can be used almost immediately for display and analysis purposes.
As image data has proliferated, the need for desktop tools to manage images has grown. Image analysis
software was previously reserved for geospatial professionals using high-performance workstations.
Esri and ERDAS have developed ArcView Image Analysis, an extension to ArcView GIS that brings these
capabilities to desktop users.
VESTRA Resources, a GIS services firm based in Redding, California, provides integrated solutions for land
management, local government, agricultural, and transportation applications. Dean Angelides, senior GIS analyst
at VESTRA, says imagery is used in nearly every project performed by the company. "I can't think of a project
that we've done in the last five years that does not involve some type of imagery. For our clients to get the most
from the data sets that have been put together, it's really important to have image handling capabilities beyond
just displaying them as a backdrop to vector data."
Angelides says that though VESTRA and many of their clients make extensive use of IMAGINE from ERDAS
and Esri's ArcInfo software, applications are primarily deployed at the desktop level using ArcView GIS.
"Image Analysis is a great package of tools for people who use imagery, which is nearly everybody, to make it
easy to exploit the imagery," says Angelides. "It unlocks things that were done in high-end research facilities and
puts them on common people's desktops."
|
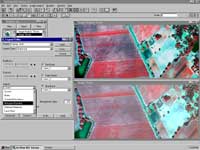
A multispectral image enhanced
using the ArcView Image Anaysis legend editor compared to the lower view that shows the same image
as depicted using standard ArcView GIS display capabilities. |
ArcView Image Analysis creates Reduced Resolution Data Sets (RRDS) or "pyramid layers" that make images
display more rapidly. Images often exceed the screen resolution of most computer monitors and graphics cards.
On-the-fly reduction of image data is computationally intensive and time consuming.
ArcView Image Analysis avoids this performance degradation by preemptively creating pyramid layers when an ArcView Image Analysis
theme is added to a view. These layers represent reduced views of the original data that has been resampled
reduced in resolution by a power of two. The original data is not changed in the process.
"If you deal with imagery in large data sets, even as a backdrop, the speed advantages are very, very significant,"
says Angelides. "It may be worthwhile to purchase this extension just for the drawing speed enhancement."
Putting Image Data to Work
Land cover classification and change detection analysis are important techniques for industries, such as timber or
agriculture, that work with large geographic areas. ArcView Image Analysis provides built-in functionality to
perform both types of analyses.
ArcView Image Analysis uses the Iterative Self-Organizing Data Analysis (ISODATA) technique to categorize
image data based on its spectral values.
In land cover classification, the known spectral qualities of various types
of land features, such as open land, forests, agriculture, water bodies, and structures, are used to identify these
areas and create a theme. Categorization of resulting land cover themes can be refined to provide information
on the types of trees or other vegetation growing in a forest.
|
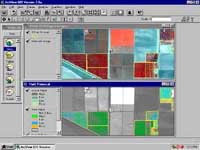
A multispectral false color infrared image displays vigorous
vegetation in bright red tones. The lower view displays the vegetation index image as a
backdrop to citrus grove vigor vegetation index values summarized using the ArcView Spatial Analyst extension.
ADAR 5500 image courtesy of Crop Image, Salinas, CA.
|
Change detection analysis is another important and growing use of image data. Images captured on different dates
can be analyzed to determine differences in spectral response. ArcView Image Analysis can work with both
continuous and thematic data. The Image Difference function uses continuous data to determine the amount
of change over time as measured in brightness or as a direct value. The Thematic Change function, used on
categorized or thematic data, is used to learn both the type and amount of change.
Both commands compare before and after themes and create a third theme that shows areas of change. An
additional tool is available when using Thematic Change on image data. The Summarize Areas function can
be used to compile information about the area in tabular form. Using these methods, foresters can track change
to monitor growth, identify pest infestation, measure forest fire damage, and schedule management activities.
Visualizing the Path of Growth
Regional transportation planning is a prime example of an application that benefits from the use of imagery.
Transportation planners are often tasked with determining the future demand for transportation systems including
light rail, highways, and streets. Often, regional databases are difficult to develop because they require data from
multiple jurisdictions.
Using imagery can help tell a story a lot faster, and at a lower cost, than trying to merge and collect data sets
from several government agencies. Angelides said, "You can very quickly derive different types of land uses
and see land use patterns changing through time. It gives you a sense of where transportation systems are adequate,
where they may need to be improved."
|
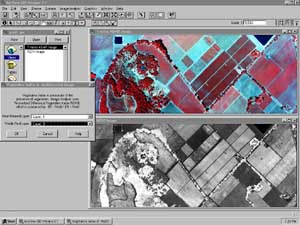
Dialog boxes make
powerful image processing procedures, such as Vegetation Index analysis, easy to perform.
The image shows the Normalized Difference Vegetation Index (NDVI) image computed from the
ADAR multispectral image shown in the upper view.
|
Angelides further notes that imagery is a valuable decision support tool in planning new transportation systems.
"Traditionally, when transportation corridors are built, it encourages growth along those routes. Growth is often
controversial, so new routes must be carefully planned. Imagery can help people visualize very large areas very
quickly, which helps in decision making. They can look at proposed facilities and determine where capacities
ought to be increased or left alone."
Assessing Farming Practices
Of all the industries that use imagery, agriculture is beginning to rely on it the most. To stay competitive in agriculture,
farmers must use new technologies to get the highest possible crop yield while paying close attention to the return
per acre of cultivated land. Imagery provides a cost-effective way to track variation in crop growth patterns through
time and across acreage.
In California, VESTRA Resources has developed precision farming applications and has particular expertise in
winery management applications.
Angelides explains, "A lot of factors influence how grapes grow. To understand
how those factors interact and relate them to the grape quality takes a fair amount of information and tools to
organize that information. ArcView GIS, along with Spatial Analyst, ArcView 3D Analyst, and Image Analysis,
is an excellent set of tools for being able to sort different factors and zero in on those that most influence the
quality at a particular vineyard."
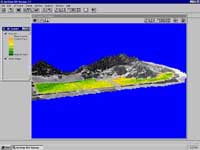
|
A vegetation vigor classification was created from
the NDVI image and vineyard blocks using ArcView Spatial Analyst and draped over the terrain model created with 3D
Analyst. |
Research has shown that if the vines are under a certain amount of water stress, they will produce higher quality
grapes. The challenge for vineyard managers and viticulturists is to maintain the appropriate level of water stress
without damaging the vines, which would make them more susceptible to disease.
Vineyard managers can evaluate the relative vigor of the vines over the course of the growth by capturing infrared
snapshots or multispectral snapshots of the vineyard at various times of the year and applying the change analysis
techniques. ArcView Image Analysis calculates the Normalized Difference Vegetation Index (NDVI) and creates
a new grayscale single-band theme that highlights areas of vegetation and measures the biomass or health of these
areas. The Vegetative Index function takes a multispectral image and computes an NDVI based on the relationship
between near infrared and red reflectance values.
Angelides says that ArcView Image Analysis is also useful for vineyard operations. "Some of the vineyards that have
been capturing multispectral imagery for a year or more now have a much better understanding of their vine vigor,
cover, and other factors. In fact, the imagery actually helps them schedule their harvesting operations.
What they used to do is bring in a huge crew that worked day and night, monitoring sugars and other factors as they harvested.
Sometimes they would keep harvesting from an operational perspective, even if the grapes weren't ready for harvesting.
With imagery, vineyards can identify indicators long before it's obvious to the naked eye. It allows the vineyard
managers to break out different areas of the vineyard that ought to be harvested at different times from others."
VESTRA often uses ArcView Image Analysis in conjunction with ArcView Spatial Analyst and ArcView 3D Analyst.
Angelides cites a situation where a vineyard was trying to determine the cause of variations in plant vigor within a
vineyard block. Evaluating soil nutrient information at different rooting depths as well as at the surface provided a
clear picture of where the problems were so that remediation could be applied.
First, ArcView Spatial Analyst was used to interpolate soil nutrient values and combinations of nutrient values,
water holding capacity, and other factors for each rooting depth. Then, ArcView 3D Analyst was used to "stack"
the soil analysis results for each rooting depth along with a vine vigor map created using ArcView Image Analysis.
Graphically displaying this data let the vineyard manager quickly identify which factors were causing differences in
vine growth. Through the knowledge gained in this analysis, the vineyard manager was also able to select rootstock
for new plantings that was better suited to the soil conditions.
Valuable Source of GIS Data
With the development of the ArcView Image Analysis extension, a very valuable data source--image data--becomes
available to GIS users at the desktop level. Foresters, farmers, regional planners, and others who work with large
eographic areas can benefit from this powerful data source in developing applications that track change over time,
categorize land cover, or monitor vegetation.
Learn more about ArcView Image Analysis.
VESTRA Resources, Inc., an Esri business partner, provides solutions in the area of agriculture, forestry,
sustained long-range planning of land resources, and natural resource management. VESTRA offers a range
of products and services from project-oriented GIS database construction, map production, and image analysis
to design, development, and implementation of integrated GIS applications.