Summer 2009
Summer 2009 |
||||||||
|
|
||||||||
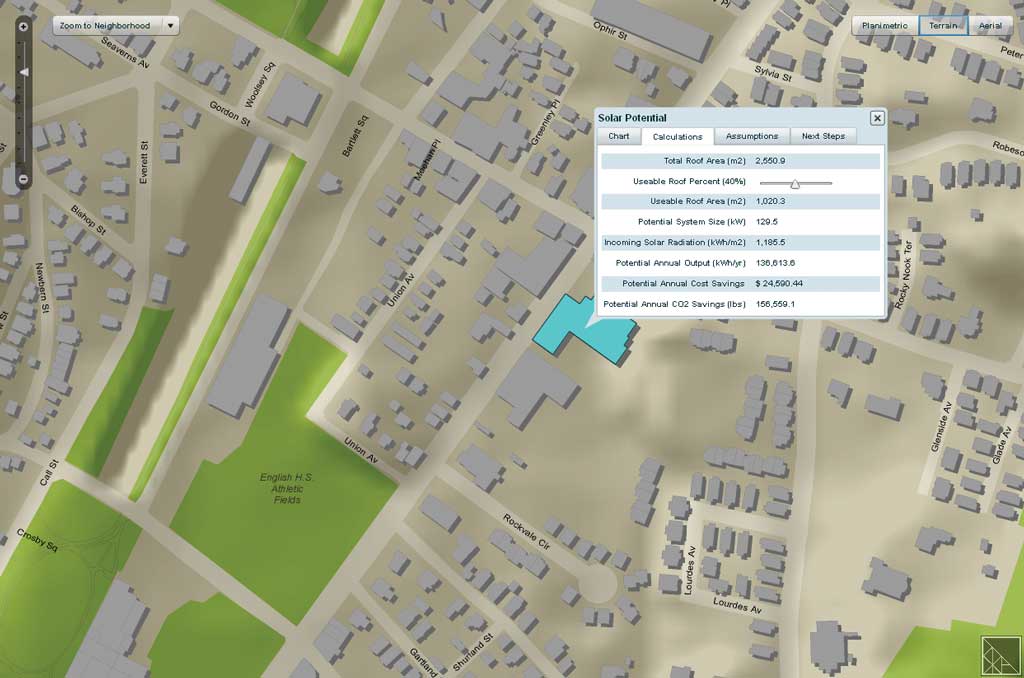
GIS is contributing significantly to the development of commercially viable renewable energy. Utilization of the two most common renewable energy sources, solar and wind, is more challenging than conventional energy sources. Both energy sources are available intermittently and are typically more geographically dispersed than oil or natural gas. GIS helps evaluate the potential of sites for energy generation and the feasibility of getting energy to users. The Boston Redevelopment Authority created Solar Boston, an online mapping application developed using the ArcGIS API for Flex, that allows users to see active renewable energy installations within the city and calculate the solar potential of building rooftops. In addition to calculating usable roof area and incoming solar radiation, this application generates figures for annual energy output in kilowatts per year, anticipated annual cost savings, and CO2 savings. The site for the wind farm project and the location of individual wind turbines within Iberdrola Renewables' Rugby Wind Project were determined using GIS to assess wind availability, take into account the existing electrical transmission infrastructure, and consider many environmental factors in the surrounding area. The project, currently under construction near Rugby, North Dakota, could produce enough power for 11,000 homes. The Grid Can't Be Smart without GISThe role of GIS in transforming utilities that use conventional energy sources is substantial. Utilities already use GIS to comprehensively inventory electrical distribution network components. In the future, existing GIS implementations will be the foundation for Smart Grid. Rather than a specific system, Smart Grid is an approach for intelligently managing the generation and delivery of energy. Not only does it help utilities handle loads more efficiently, it also enables interaction between the providers and consumers of electricity and significantly automates the process of restoring the network after an outage.
Today, most electricity utility systems are passive and unaware of problems in the field. Other than information about main supply substations, these systems have little information on their status. Spatial technologies offer the breakthrough needed for utilities to operate much more effectively and interactively. Utilities will use GIS as a method for organizing data collected from sensors and smart meters and communicating status information to the utility and its customers. CenterPoint Energy, a Texas company that supplies electricity and gas to approximately three million customers, has a sophisticated enterprise GIS that meets both its engineering and business needs. In 2007, the company deployed Smart Grid technology on a limited basis in Houston, initially installing 10,000 smart electric meters and 500 smart natural gas meters. Following this successful project, the company received approval from the Public Utility Commission of Texas (PUC) to deploy 2.4 million smart electric meters over five years, beginning in 2009. According to CenterPoint Energy's GIS manager, Cindi Salas, "GIS technology plays a key role in the automation strategy in that it will provide the initial infrastructure data that will fuel the automated analytics." Spatializing Stimulus SpendingThe development of the Smart Grid is just one example of how GIS technology is helping rebuild and expand the nation's infrastructure. The American Recovery and Reinvestment Act of 2009 (ARRA) dedicated billions of dollars to jump-starting the economy. These funds will be allocated to thousands of projects that will rebuild the nation's physical and technological infrastructure. GIS provides tools for evaluating and prioritizing these projects so ARRA funds are spent in the most beneficial manner. An article in this issue, "Geographic Insight—A more rational approach to managing stimulus spending," describes how GIS has been used on the local, regional, and state levels for identifying and targeting problems, prioritizing projects and programs, measuring the performance, and ensuring government accountability. In addition to highlighting existing applications used by the City of Baltimore and the State of Maryland, this article illustrates how GIS can foster government accountability on the national level. Esri has developed a prototype application called FedStat that can be used for prioritizing and tracking the billions of dollars allocated to the ARRA. Just as the value of GIS is greatly amplified when it moves from the project or department level to an enterprise-wide implementation, FedStat offers data management, analysis, and visualization capabilities that will assist government in spending stimulus funds in a manner that will truly revitalize the United States economy while promoting government transparency and accountability. Come for the Savings, Stay for the QualityIn good economic times, government agencies and businesses were attracted to GIS because of its promise to save time and money. In an economic downturn, the ability to do more for less has become imperative for organizations. Historically, GIS has done just that by increasing productivity, automating processes, and increasing efficiency. However, the insights provided by viewing data in a spatial context have fostered better resources management and increased collaboration and communication. With the development of Web GIS in recent years, the tools of GIS available to policy makers at all levels of government can enable more informed decision making and performance measurement. |