ArcUser
Summer 2012 Edition
Keeping Traffic Moving during Bridge Repair Project
By Matthew DeMeritt, Esri Writer
This article as a PDF.
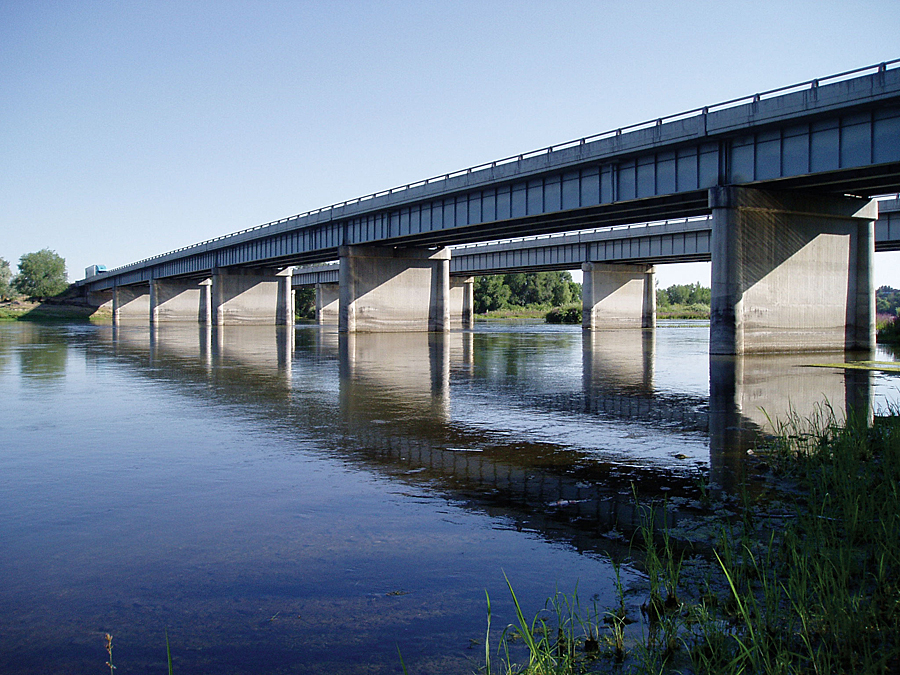
The Oregon Department of Transportation repaired the Snake River Bridge on Interstate 84 as part of the OTIA III State Bridge Delivery Program.
With 12 percent of US bridges declared structurally deficient by the Federal Highway Administration in 2006, bridge repair remains a top priority for most states. Three years before that, an extensive investigation of Oregon's bridges conducted by the Oregon Department of Transportation (ODOT) found that 365 of Oregon's bridges had structural problems that necessitated a large-scale bridge repair plan. Implementing that plan required that the department expand its GIS infrastructure and integrate a new traffic modeling application to ease congestion at multiple construction zones along the state's highway system.
Oregon Transportation Investment Act
From 2001 to 2003, Oregon passed a series of funding packages called the Oregon Transportation Investment Act (OTIA I, II, and III) to improve its highway infrastructure. For OTIA III, which included the State Bridge Delivery Program, ODOT turned to engineering consultants Oregon Bridge Delivery Partners (OBDP), a joint venture between HDR Engineering and Fluor Corporation, to create practices that would ensure the project finished successfully and within budget. One of the primary goals of the program was to reduce the impact on commuter and business traffic during large-scale construction on its road system.
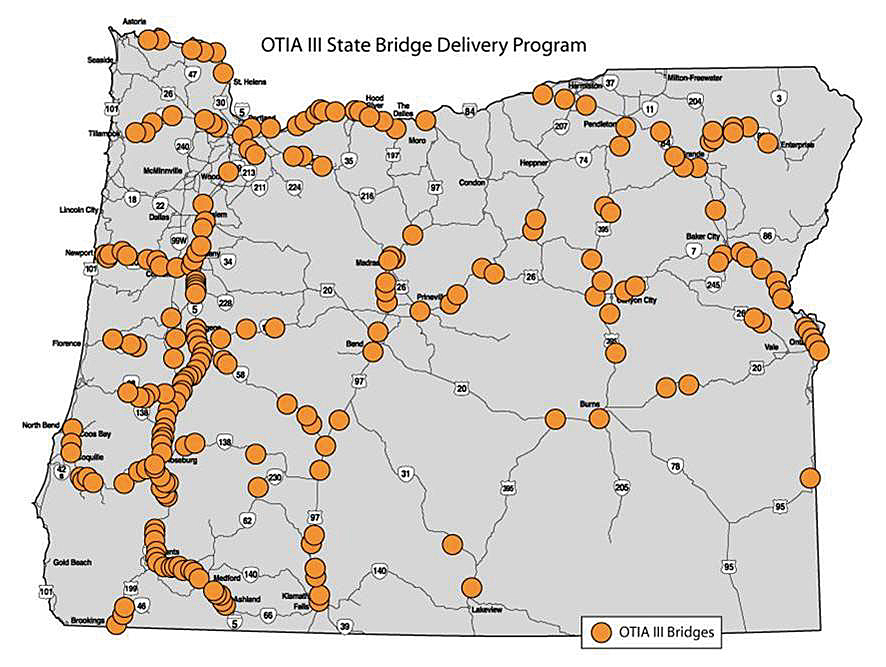
The OTIA III State Bridge Delivery Program is a 10-year, $1.3 billion program that will repair or replace hundreds of aging bridges on Oregon's highway system.
Many of the bridges designed during the early development of Oregon's highway system used a reinforced concrete deck girder (RCDG) design specified in the regulations of that time. As specifications became more stringent in the 1960s, Oregon transitioned to pre-stressed and post-tensioned concrete bridges that improved structural integrity at a reduced cost. However, many RCDG bridges remained in service well past their expected decommission date and began to show signs of deterioration on deeper investigation. "In 2001, ODOT inspectors noticed that cracks identified in previous inspections had grown to the point of threatening structural stability," said Jim Cox, assistant manager of major projects at ODOT. "We immediately placed load restrictions on these bridges and started discussion on how to plan repairs with the least impact on commercial and commuter traffic."
GIS and Geodesign
Established in 2004, ODOT's GIS comprised the department's information-sharing infrastructure to plan and manage roadway projects. To integrate with ODOT's GIS, OBDP designed its system on the same ArcGIS platform for flexibility and scalability throughout the project life cycle and beyond. "We wanted easy adoption of tools and practices to smooth transition during project closeout and ensure usefulness beyond that," said Robb Kirkman, GIS Services manager for HDR Engineering. "GIS provided the foundation to start linking program systems, automate tasks, and better mitigate environmental impacts."
Before any construction work began, ODOT collected comprehensive environmental data on more than 400 of its bridge sites to identify nearby environmental resources. Standard ODOT practice involves consultation with experts such as biologists, wetland specialists, and archaeologists to get a better understanding of the effects of construction zones in ecologically sensitive areas. "We took a different approach for the OTIA III Bridge Program by conducting environmental fieldwork before we did any design," said Cox. "In ArcGIS, we drew a box around a bridge site and identified all the resources inside the box. This allowed the engineers to develop designs that minimized impacts on the surrounding environment."
Improving Work Zone Traffic Analysis
Prior to its collaboration with OBDP, ODOT had been using spreadsheets containing traffic counts and automatic traffic recorder information from across the state to document and predict traffic impacts for its various road construction projects. That process could take up to four hours for each scenario because data had to be searched and collected from multiple databases within the agency and then inserted into a spreadsheet. "Gradually, that process evolved to incorporate GIS processes," Kirkman said. "Using macros and automation tools in ArcGIS, ODOT's traffic group was able to automatically populate the spreadsheets with information from the database."
The department can run traffic scenarios in a matter of minutes—rather than hours—enabling ODOT engineers to modify traffic plans on the fly. Easy access to reliable data helped the agency determine how to stage projects with minimal delays.
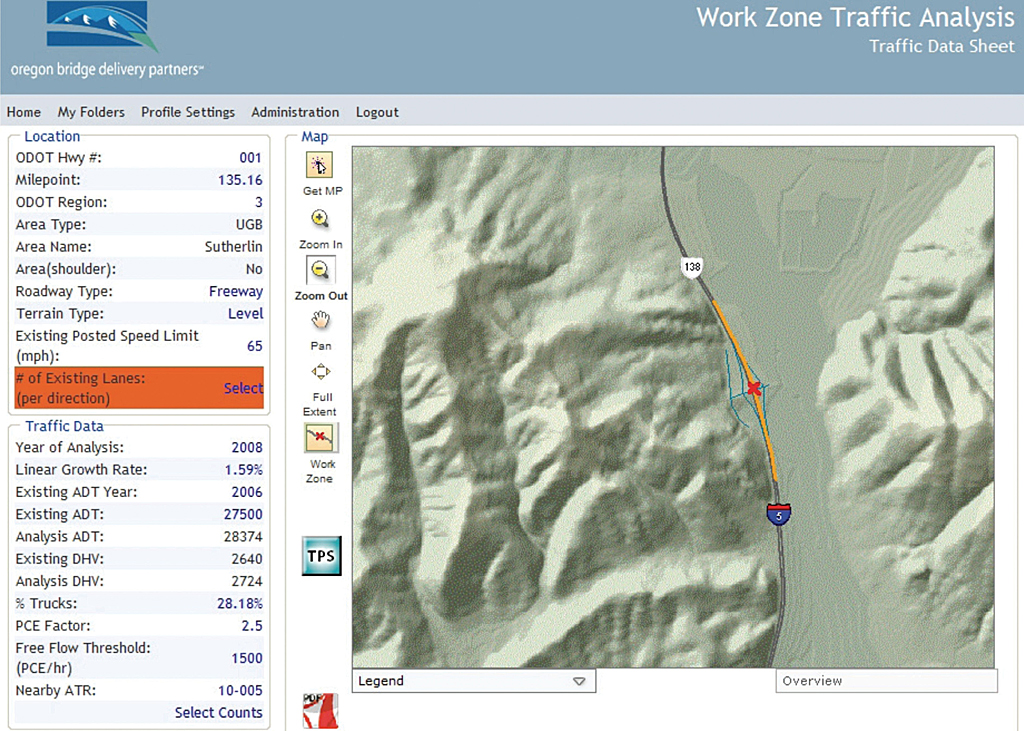
Although much leaner, the spreadsheet-only approach experienced crashes as the database grew ever larger. The traffic team worked with OBDP to develop a more efficient GIS-based method for running traffic scenarios—one that tightly wove ODOT's geospatial data into a dedicated web-based analysis tool. Using common protocols, they worked on tying the datasets together to give ODOT staff direct access to the department's databases from a single interface. Called the Work Zone Traffic Analysis (WZTA) tool, the application allowed traffic scenarios to be run and shared in a web browser.
WZTA serves as a repository for information on traffic and road data that can be accessed and queried in a browser. The system allows users to view ODOT data to determine the effects on mobility created by lane closures related to construction and roadwork. Today, the department can run traffic scenarios in a matter of minutes, eliminating redundancy and enabling ODOT engineers to modify traffic plans on the fly.
Using a GIS-based interface also improved accuracy by allowing ODOT analysts to select the location and other information for a specific project site from the map itself rather than tabular lists. "Lookup tables using numbering systems aren't intuitive to all users," Kirkman said. "GIS enabled users to find exactly what they were looking for and verify the correct project information within a more appropriate map-based user interface where spatial relationships are more obvious."
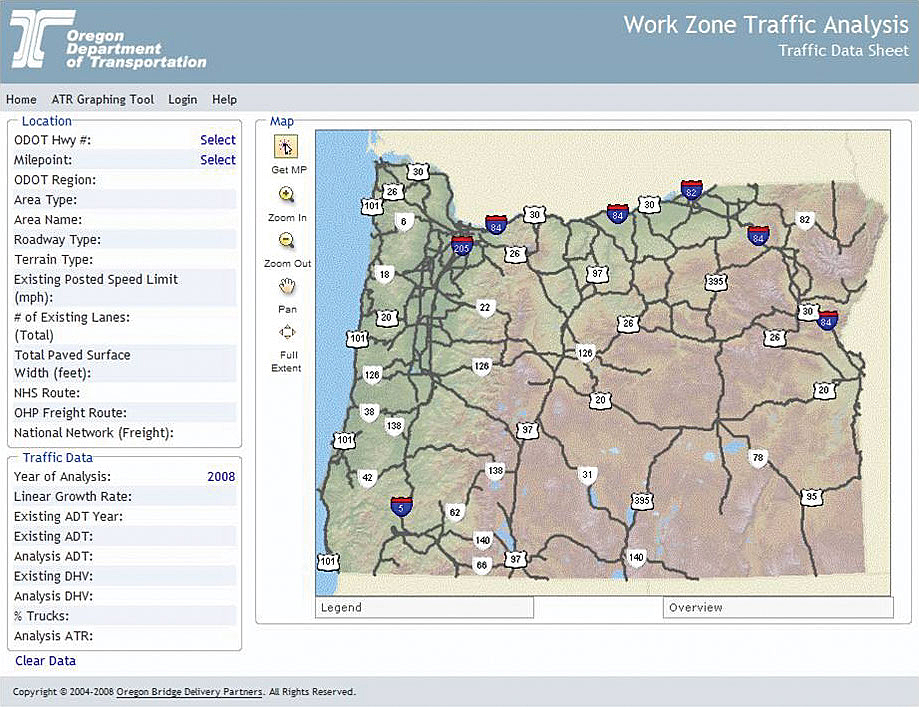
Using a GIS-based interface, ODOT analysts can select the location and other information for a specific project site from the map itself rather than tabular lists. In 2007, WZTA received the Team Excellence Pathfinder Award from the American Association of State Highway and Transportation Officials.
Documented Return on Investment
In 2010, ODOT and OBDP documented their experience with the tools to evaluate the impact of ODOT's investments and determine if they should be used after completion of the bridge program. With the assistance of economic consultant Mark Ford, they analyzed every piece of software OBDP created for the OTIA III Bridge Delivery Program to determine the economic benefits and cost to the department. The study concluded that ODOT experienced a combined benefit-cost ratio of 2:1 for all enterprise IT investments related to management of the bridge program.
ODOT's GIS infrastructure alone returned a benefit-cost ratio of 3:1. "Integration of formats and standards proved to be important in generating value from the investment," said Ford.
In addition to these tangible benefits, ODOT experienced three types of intangible benefits. Migrating the data from disparate sources into a unified system allowed OBDP to employ consistent analysis methods, reducing the risk of calculation errors. The centralized database also made it easier for ODOT to maintain data integrity and reduce the risk that analysts working at different locations could use outdated information. "Systems like ODOT's GIS infrastructure generate accurate, consistent, and timely information for reporting and responding to inquiries," Ford said. "WZTA, and GIS in particular, has resulted in improved coordination with other agencies and interest groups, increasing the credibility of both ODOT and the bridge program in the eyes of the public and the legislature."
At the beginning of 2011, 351 of the 365 bridges in the OTIA III Bridge Delivery Program were free of construction zone delays. WZTA played a primary role in expediting the construction process by allowing the team to run lane closure traffic analyses in minutes as opposed to hours. The tool is now being used by ODOT on other roadway maintenance and construction projects to quickly determine impacts from lane closures across the state.