ArcUser
Summer 2012 Edition
Mapping Roadway Fatalities
Website increases awareness and understanding
By Brian N. Hilton, Claremont Graduate University
This article as a PDF.
With tens of thousands of automobile fatalities each year, traffic safety is a major public health issue. Unfortunately, these alarming statistics do not always receive the attention they deserve. While researching the role of information technology in making emergency response systems more effective, Tom Horan, dean and professor at the School of Information Systems and Technology (SISAT) at Claremont Graduate University (CGU), noticed that geographic information about traffic fatalities was not used to its fullest potential.
"I've been working on a variety of research studies on health and transportation," said Horan. "I started to think about the public health problem that these fatalities represent." Automobile accidents are the number-one killer of teenagers in the United States. To increase understanding of this issue, Horan began a project to make traffic fatality statistics for the United States accessible from an easy-to-use website.
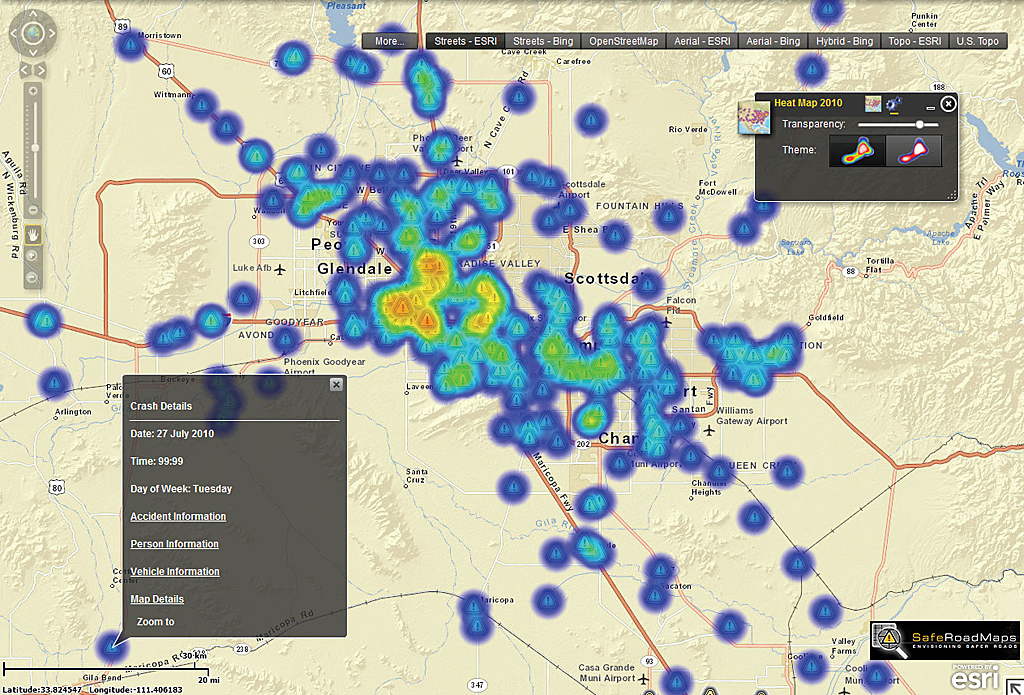
The SafeRoadMaps website, built using the ArcGIS API for Flex, provides analysis and visualization of Fatality Analysis Reporting System (FARS) data. This heat map shows at a glance where concentrations of fatalities have occurred.
The SafeRoadMaps website was developed by SISAT research faculty member Brian N. Hilton, who directed a team of SISAT students. Hilton teaches classes in GIS solution development at SISAT. The website offers interactive maps that display where vehicular fatalities have occurred at the community level. When a visitor types an address or ZIP Code into SafeRoadMaps, the site displays information from state geodatabase records. SafeRoadMaps uses data from the Fatality Analysis Reporting System (FARS) provided by the National Highway Traffic Safety Administration for the years 2001–2010. FARS contains data on all fatal traffic crashes within the United States. Each case has more than 100 coded data elements that characterize the crash, the vehicles, and the people involved.
"SafeRoadMaps displays the key data on automobile accidents," said Horan. Visitors can discover when the accident occurred; how many people were involved; if the fatality was a driver, passenger, or pedestrian; and whether alcohol or some other inebriate was involved. The site also displays a photo of the location where the accident occurred.
Since its inception in 2008, the SafeRoadMaps website has logged almost 12 million hits. It serves a variety of user types and needs and houses an expanding spatial database. As Horan observed, "ArcGIS for Server provides us with the ability to more easily integrate our growing quantity and variety of data sources, allows us to perform more complex spatial queries, provides advanced geoprocessing functionality, and facilitates the creation of map tiles on the fly. In addition, we're using ArcGIS Viewer for Flex for rapid user interface development, something that was time-consuming and unwieldy with the previous implementation."
The first version of SafeRoadMaps was launched in 2008. It integrated a range of spatial data relating to motor vehicle crashes, transportation policy legislation, and driver behavioral data in a visual representation of traffic safety across the United States. In 2009, the second verson of SafeRoadMaps was launched. It extended functionality to include national heat maps to communicate the spatial density of traffic fatalities. Concurrent with the analysis and development of the national heat maps, the top 100 rural and urban hot spots were identified. The third version of SafeRoadMaps, launched in 2010, included data for all years that contain georeferencing information and featured new, user-friendly interfaces: My Travel, My Community, My State, and Analysis & Tools. Hot spot analysis was also extended across both spatial (rural/urban) and temporal (summer/nonsummer) dimensions. The release of the fourth version on May 16, 2012 was timed to coincide with the launch of Data.Gov/Safety, a government website to increase awareness of public safety activities. SISAT participated in this event.
The SafeRoadMaps site is part of a multiyear collaboration between SISAT and the University of Minnesota's National Center for Excellence in Rural Safety (CERS). Lee Munnich, the center's director, noted that "SafeRoadMaps has provided an invaluable tool for communicating about the issue of traffic safety and raised national policy awareness of this public health problem."
Although the site was created for public use, Horan has been approached by organizations, such as driver's education programs, that are interested in creating specialized SafeRoadMaps modules. Throughout the website's development, Horan briefed James L. Oberstar, former US representative from Minnesota's 8th congressional district and chairman of the House Transportation and Infrastructure Committee (2007–2011). Oberstar has championed the site.
Although Horan's research is novel, he pointed out that it falls on the continuum of work that has created the field of public health. "Epidemiology got its start when there was a cholera outbreak in London. An intrepid researcher named John Snow mapped the cases and discovered it was originating from a specific public water pump. What we're trying to do is bring that same sensibility—a map, a visual tool that can help people understand the problem of public safety—and improve upon it."
For more information, contact Horan (tom.horan@cgu.edu) or Hilton (brian.hilton@cgu.edu) or visit www.saferoadmaps.org.