ArcUser
Fall 2011 Edition
App Supplies Bus Locations and Schedules
Creating the Yakima Transit iBus widget
By Tom Sellsted, City of Yakima, Washington
This article as a PDF.
Yakima residents now know when their bus will arrive, thanks to the iBus widget. Created for Yakima Transit, it provides more schedule information than previous applications and lets citizens and transit staff monitor bus locations and consult schedules from the Yakima website.
Yakima, located in central Washington State, covers 28 square miles and has more than 91,000 residents. The city offers a full complement of services: police, fire, water, sewer, refuse, and transit. All city departments need location-based applications and analysis, so there are many opportunities for supplying GIS services. The analyst and technician, who comprise the city's GIS staff, also provide services unrelated to GIS. Limited staffing resources have motivated the city to become efficient and take advantage of new technologies to enhance city services.
Yakima Transit operates 10 fixed routes that cover the communities of Yakima and Selah. A complete trip of each route is made each half-hour on the routes with larger riderships and hourly for all other routes. Transit service is available seven days a week and most holidays, with full service on weekdays and abbreviated service on weekends and holidays.
Transit Application History
Starting in 2000, GIS applications for bus locations and routes were developed for Yakima Transit using MapObjects and Visual Basic 6. These applications included a server, client, and Google mashup for public viewing. The server application received position updates from buses equipped with GPS cellular modems and relay position information to logged-in clients. The position information was written to Microsoft Access database tables so transit dispatchers and management staff could view the real-time positions of all GPS-equipped buses.
The main problem with this approach was that the data for routes had to be distributed with each update. Route updates generally happen quarterly. Edits were made and exported to shapefiles that were distributed to each desktop. In addition, route changes for extended road closures also required editing and the distribution of shapefiles.
While these applications were functional, they could not access newer feature classes in the geodatabase. Application and data distribution became more difficult with limited time and budget dollars. After MapObjects was retired in 2004 and Visual Basic 6 gave way to .NET, it was time to look for a new way to provide applications and information to city departments and Yakima Transit.
Utilizing a geodatabase provided an opportunity to streamline data handling. Esri's ArcGIS API for Flex, ArcGIS Viewer for Flex, and REST services offered an excellent solution to these problems. Edits made in the geodatabase are immediately available to everyone, and no duplicate data distribution is required. ArcGIS Viewer for Flex supplied a great foundation for the iBus widget. All the tools needed for a web mapping application were already in place and very configurable. When the widget was ready for use, it was posted in the ArcGIS Viewer framework and made available to anyone with a web browser and the required version of Flash player.
Schedule + New Real-Time Bus Locations
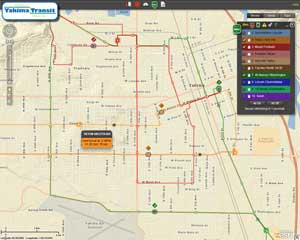
A primary goal of the iBus widget was inclusion of the actual bus stop schedule information for each route to complement near real-time bus position updates. The position of the schedule in relation to the actual bus position lets the viewer know whether the bus is on time or late.
The previous mashup provided only bus location information for the routes they were assigned. Schedule information for most route segments, supplied from the Yakima Transit bus book, was available via an associated PDF link. However, though there are about 25 segments for each route, only 10 segments would have schedule information.
Bus stop scheduled times were not available for each route segment. For segments not containing a time schedule, a calculation was made using each segment's sequence of travel and the number of seconds it took to travel the segment. These calculations are made as the route feature class is loaded into the widget.
Because each route segment now has a set of scheduled departure times for every day, a timer can be used to determine which route segments are active at any specific moment. Subtracting the assigned travel time for the segment from the next available departure time will equal the start time for that segment. If the current time falls between the start time and stop time, it is an active segment. To indicate that a segment is active, its endpoint is made to glow.
Consequently, it is important that the clock on the client computer is accurate. Most computers perform a time sync with an accurate Internet clock. It is also necessary for the client's time to be in the same time zone.
The active segments are used to model the scheduled location (where the bus should be if it is on time) of the route. Each active segment is a simple polyline composed of a single path with at least two points. Since starting, stopping, and current times are known, a percentage of each segment's completion can be calculated. This percentage can also be applied to the segment's geometry to find between which two segment points the scheduled point should fall. A program loop that evaluates the length of the summed points and compares it to the total length of the segment makes this determination. The loop also compares the summed distance of the points to the percentage along the route to determine which two points will be used to calculate the angle of the marker arrow. A trigonometric function is used to determine the position of the marker. The position for the percentage along the route is used for the schedule point geometry. By default, this is updated every five seconds and can be adjusted by the user.
GPS in Near Real Time
In addition to the scheduled points, the widget shows near real-time bus location information supplied by GPS. Most buses have a Sierra Wireless MP595W modem that is configured to send its location to a designated server. For this project, a Python script has been set up as a service and is used to receive these User Datagram Protocol (UDP) position reports and write them to a vehicle table and a historical positions table in the automated vehicle locator (AVL) geodatabase. The Python script is 150 lines of code that listens on a designated port. As a position report is received, the message is parsed to the appropriate fields and geometry is created from the latitude and longitude. An ArcPy update cursor is used to modify the vehicle table using the vehicle modem's IP address as the key. An ArcPy insert cursor is used to add a record to the historical positions table. Using Python made this a very efficient and simple way to obtain vehicle information.
Another timer is used to query a REST service for the latest position of each vehicle. Only vehicles that have been assigned to a route are part of this query. A back-office widget allows the transit dispatchers to assign buses to the appropriate routes for the day. The returned vehicles are drawn on the map as color-coded graphics and rotated to represent their current heading.
Back-Office Widgets
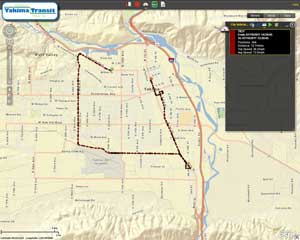
Additional widgets were added for transit dispatchers and management staff to make bus assignments to fixed routes and display historical bus positions. The bus assignment widget queries the vehicle REST service for all buses. A drop-down box is displayed next to each bus and allows the user to select the route. Once all the assignments have been made, clicking a button updates the geodatabase. The city vehicles widget is used to display historical vehicle positions so management can ensure that vehicles are traveling on time, using the correct route, and not exceeding the speed limit while driving the route.
Problems Encountered
While the Flash player is supposed to be browser independent, small idiosyncrasies were found when using Internet Explorer. Custom MapTips would not display properly. However, a simple change to the way the tip was initialized fixed this problem, although it was difficult to diagnose. In addition, when a vehicle position query was made in Internet Explorer, the previously cached query result was used. Logic was added to make each query unique so when the timer expired and a new query was made, a fresh result was returned.
Assigning buses to routes is critical to make the buses appear properly on the map or calculate whether the bus is on time or behind schedule. Buses actually on a route but not assigned to a route won't display at all. Buses assigned to the wrong route are displayed with the wrong color.
Future Enhancements
Additional logic will be added to calculate the estimated arrival time for buses along routes so riders can know how long they will have to wait for buses at their favorite stops. Similar logic will allow the widget to determine whether the bus is on time or late.
Adding an advertising widget to the system is being considered. This widget would be configurable to display an icon for each location of interested businesses. A timer would be used to rotate each interested advertiser and display its information. While this could be a new source of income, it might also detract from the application's appeal to riders.
Acknowledgments
Thanks to Robert Scheitlin for his custom splash screen for the iBus widget and his many great examples of Flex. Thanks to Jill Ballard, GIS technician at the City of Yakima, for her editing skills and work on the datasets in this project. This project would not be possible without that data.
About the Author
Tom Sellsted, employed by the City of Yakima since 1985, has worked on GIS activities since 1988. He is a supervising senior GIS analyst for the city. He graduated from Central Washington University with a bachelor's degree in management science.

