ArcUser
Fall 2011 Edition
Innovative Strategy for Facility Upgrading
Hill AFB uses ArcGIS to manage thermal IR imagery
By Karen Richardson, Esri Writer
This article as a PDF.
How do you check the soundness of the roofs and utility system for 1,300 buildings—spread over more than 10 miles—in a comprehensive and cost-effective manner?
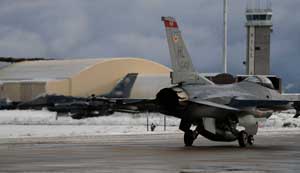
Two F-16 Fighting Falcons taxi down the runway prior to takeoff from Hill AFB. Many operational and support missions are located in the base. (US Air Force photo/Senior Airman Devin Doskey)
Hill Air Force Base (AFB) used ArcGIS and thermal infrared radiation (IR) imagery to identify failing roofing and utilities. The base, part of the Air Force Materiel Command (AFMC), is located in northern Utah near the city of Ogden. Many operational and support missions are located here, including maintenance of the F-16 Fighting Falcon, the A-10 Thunderbolt II, and the C-130 Hercules aircraft.
The main base covers 10.2 square miles, and its buildings are used for aircraft maintenance and upgrades as well as technical and training facilities for flight staff on the base. This critical infrastructure houses personnel as well as assets and services worth hundreds of millions of dollars.
Many of the buildings on the base date back to the 1940s. As the result of normal wear and tear, this infrastructure, which includes a maturing utility system, was deteriorating. Little reliable data had been kept on the condition of these facilities. Failing roofs were often discovered by the personnel directly affected by a leak or when the damage was extensive enough that it could be seen. Limited facilities information made identifying and fixing these issues expensive and time-consuming.
Historically, Hill AFB personnel inspected roofs, but the manpower and money required to conduct physical building-by-building roof inspections have made this impractical. Alternatively, the price tag for replacing all the roofs was prohibitive.
Discovering Roof Failure with Thermal IR Imagery
To find a solution that would help them work more intelligently and efficiently, Hill AFB personnel turned to ArcGIS. Most air bases are standardized on Esri GIS technology. Hill AFB, a longtime user, had a site license for ArcGIS that allows use of the software throughout the base for everything from topographic mapping to flight charting.
Working with Esri partner Woolpert, Inc., based in Dayton, Ohio, members of the GIS department took existing topographic maps and overlaid them with aerial photographs of the buildings to map the facilities, including 12,000,000 square feet of roofing. Although this provided them with a visual representation of infrastructure location, the problem of cost-effectively finding failing roofs and pipes was still unresolved.
"We thought incorporating thermal infrared imagery into our facilities maintenance would be an efficient solution to identifying our failing infrastructure," said James Wright, GeoBase manager, 75 CEG/CEAO. [The Air Force GeoBase program supports use of geospatial information technologies at Air Force installations as corporate knowledge management resources.]
Thermal IR imagery shows heat and is often presented as a grayscale picture. Shades of gray indicate differences in temperature and emissivity (i.e., the ability to emit energy by radiation) of objects in the image. Typically, objects in a thermal IR image that look lighter are warmer and those that look darker are cooler. Thermographic imagery shows the unique heat signatures produced by different environmental conditions on physical materials. For example, by looking at thermal imagery, it is possible to see how buried chilled-water lines cool the surface above the line.
The wet areas of roof materials have distinctive thermal characteristics. Latent heat, caused by the sun shining on rooftops during the day, is trapped in the water mass of those areas. The heat in those areas is greater than the heat absorbed by dry insulation or roof substrate. As the rooftop cools after sunset, wet areas of roof insulation and other materials continue radiating heat. That heat can be detected and its signature captured with thermal equipment.
Efficient Image Processing
"Thermal IR promised significant potential cost savings, since it is much cheaper to fix a roof before it fails," explained Wright. One reason for this cost savings is manpower. Data for the entire installation can be collected in one night rather than the time needed to individually inspect 1,300 buildings. Also, information on buildings with rooflines on multiple levels can be collected easily using thermal IR, unlike ground-based survey methods that require staff to access each roof level.
Woolpert staff flew the base with a fixed-wing aircraft and captured nadir images of the base. (Nadir images are taken by pointing the camera straight down toward earth.) Thermal IR is stored and used in the same manner as other types of raster data, so no special requirements were needed to view, analyze, and store this data in ArcGIS.
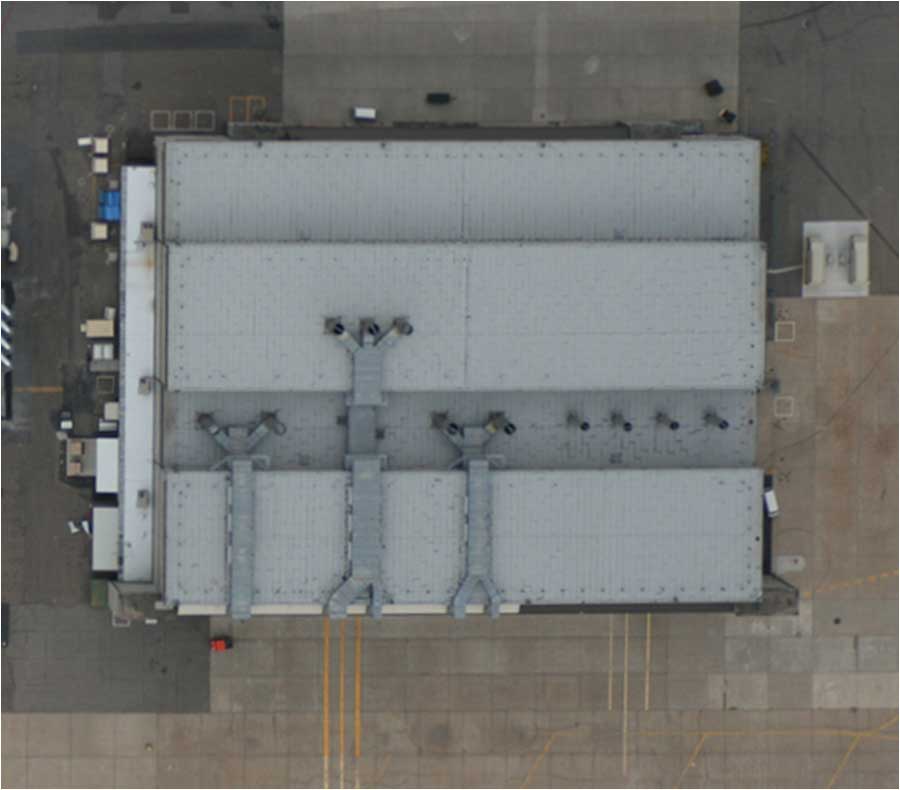
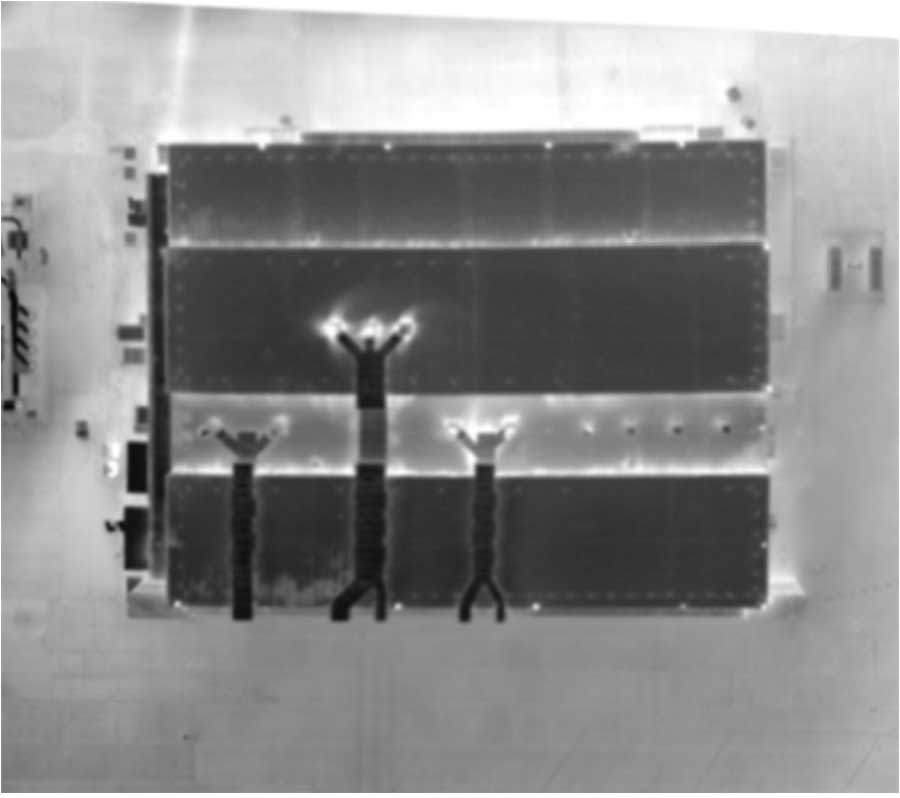
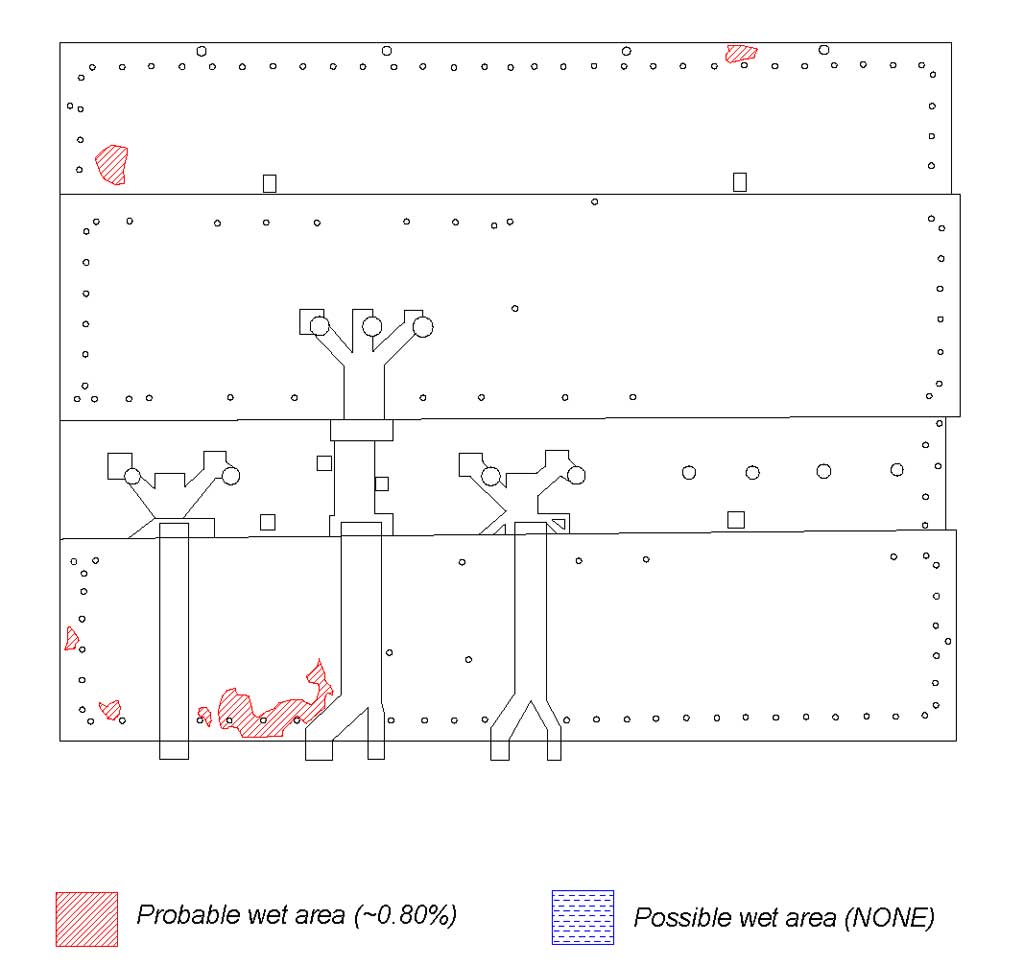
Comparison of standard RBG orthophotography (left) and thermographic imagery (center), which shows areas of water infiltration. Those areas are indicated on the sketch (right).
Once collected, the raster imagery is processed with ArcGIS and delivered in georeferenced vector and raster datasets that seamlessly integrate with existing GIS data used at the base. Staff can manage different image resources, such as thermal IR and aerial photos, in ArcGIS, which supports most existing raster and imagery formats. This simplifies image management and workflows.
Imagery is stored as mosaic datasets. Original datasets are referenced when imagery is accessed by the user, reducing storage requirements because multiple versions of the imagery aren't stored. This is an advantage when dealing with large files such as the thermal IR files, which were captured at an eight-inch resolution.
ArcGIS was used to analyze the thermal IR imagery for the probability of water infiltration or leakage and the amount of square footage affected. More than just a picture of roof damage, the imagery provided real data for analysis. "We like to use imagery because it isn't reinterpreted and so it retains all the original information, making it a perfect choice for analysis such as feature extraction, classification, suitability, and measurement," said Daniel Michalec, application specialist at Woolpert.
Data and reports generated from this analysis allowed staff to determine roofing needs and prioritize each building. Work orders were then created based on the analysis and entered into the work order system used throughout the Air Force's Automated Civil Engineer System (ACES).
Cost Savings and Discovery
Besides the deteriorating roofs, using the thermal IR found older areas of the base that have utility systems that are becoming increasingly volatile. Leaking steam lines are easily identified in the images as white lines. Because the raster is geospatially accurate, these utility locations can be identified, surveyed or digitized, and then loaded into ArcGIS. This eliminates the need for costly, ground-based detection to seek out malfunctioning lines. "Thermal IR roof inventory saved us money compared to traditional, manual roof assessment," stated Wright. For more information on how GIS is used in facilities management, visit esri.com/fm.