ArcUser
Fall 2011 Edition
Student Finds a New Lease on Life
Seeing the community through Community Analyst
By Karen Richardson, Esri Writer
This article as a PDF.

Candace Tshirki
A university student found Community Analyst the perfect tool for exploring food accessibility and many other topics.
After living and working in the Midwest, 50-year-old Candace Tshirki moved to Florida to gain a new lease on life. As part of reinventing herself, Tshirki enrolled at the University of North Florida in Jacksonville.
While there, she studied under Dr. Jeffrianne Wilder, an assistant professor of sociology. The department offers classes on racial and ethnic relations, colorism, sociology of black Americans, and qualitative methodology. In Wilder's class, Tshirki was introduced to a paper written by Dr. Shannon Zenk entitled "Fruit and Vegetable Intake in African Americans: Income and Store Characteristics" published in the American Journal of Preventive Medicine. This paper looked at food accessibility and contained a study of the spatial patterns inherent to food access in Detroit, Michigan.
Tshirki had some experience with GIS before moving to Jacksonville. She had worked in the print-on-demand industry creating maps using ArcGIS. Knowing the capabilities of the software, Tshirki was fascinated by the idea of applying it to food accessibility issues in her newly adopted county. To learn more, she took an introductory GIS class from Dr. Chris Baynard, an assistant professor in the department of economics and geography.
Power to the People
"As part of taking the class, I got a subscription to ArcUser magazine," said Tshirki. "The issue looked at how place affects health, and I must have read it cover to cover in one sitting." Seeing these different applications helped Tshirki understand even more about the power of GIS. "It really opened my eyes to the many applications of GIS," she said. "Using it, you can help communities plan for all sorts of activities, including food accessibility. The possibilities are endless."
Tshirki's food study began the hard way: collecting the data needed to perform analyses. "Getting information was very tough," said Tshirki. "It wasn't in a central place. I ended up collecting data about restaurants and food stores from Internet searches, phone books, and restaurant licensure found through the county's website."
Everything had to be printed out, since it wasn't available in a format that could be imported readily. In the end, Tshirki entered almost 2,500 businesses, representing well over 100 hours of work. This did not include finding the census data and other information she needed to really look at the problem.

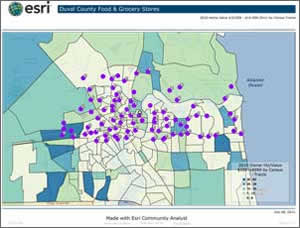
One aspect of food accessibility is the availability of food and grocery stores. This map explores the location of stores in relation to home values.
Wanting to find an easier way to continue with the study, Tshirki turned to Community Analyst, a Software as a Service (SaaS) mapping solution hosted by Esri that provides GIS capabilities in a simple and easy-to-use framework. The university holds an Esri site license and participated in the beta program for the Community Analyst solution. When the solution went live, Tshirki logged on to Community Analyst and created a site that basically replicated the study done by the author of the academic article that had first caught her eye. In less than five hours, she had created a point layer of all the food access points in Duval County and began to view that information along with all the data that was available with the solution, such as up-to-date United States census information and Esri demographic data including vacancy rates and how far people must travel to work.
"I found out I didn't have to be a specialist to use it," said Tshirki. "GIS is powerful. With this solution, the power comes from where it should—instead of a really technical user, the power is in the information you can see and analyze and the ability to share that with others."
Opening Up a Dialog
Many studies of food accessibility focus on the urban core, where most available food comes from local convenience stores. But Tshirki had a different vision. "The University of Florida is located by the beach, not the urban core of Jacksonville, but we face the same problem," said Tshirki.
The five-mile area surrounding the university is served by only two grocery stores. Transportation is key. It may be more convenient to walk five blocks to a fast-food location or a convenience store than to drive to a grocery chain store. Food accessibility did, in fact, seem to be a big issue.
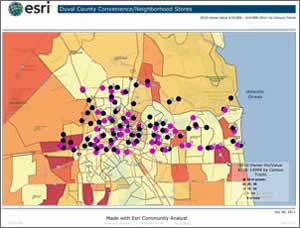
With dots representing convenience stores populating the map, Tshirki was able to zoom in and out, looking at one dot and then comparing it to others to get a real perspective on food access in the county. "We were able to view an area and then delve a little deeper to see what was really in there," said Tshirki. "And we did this live, with real data, using it in a highly visible way."
Some areas of Tshirki's map lacked dots where many people thought there should be some. When this happened, she looked at the map and changed the variables being viewed. For example, when looking at a layer lacking grocery stores, she also looked at a layer describing the percentage of people who own cars in the area. "I was able to compare this different information on the fly and show the people who were asking about this very easily."
One particular area was a neighborhood located in a lower socioeconomic part of Jacksonville. For 40 blocks, there was no place to buy food. "We knew there wasn't food available in this area, but for 40 blocks?" said Tshirki. "To be able to map that is phenomenal. Using a map, this popped out at us right away. It opened a dialog about what this means and what can be done."
Boundless Applications
Tshirki sees applications for Community Analyst all around her. She is currently assisting the small Episcopal church she attends with long-range goal planning. "I thought it would be a good idea to look at who our neighbors were," said Tshirki. "Looking at maps and traffic counts and creating one-, three-, and five-mile radiuses around the church, we found out a lot of information about ourselves."
What Tshirki found was that 10 percent of the population was Hispanic, many lived in apartment buildings, and most people in the area were in the lower income range. "We are less than a mile from the beach," said Tshirki. "We're not a poor church. Driving up and down the main arterial, we look a lot more affluent than we are."
By having this information readily available in an easy-to-discover solution, the church can now make plans to be an integral part of the community. "Instead of doing something because someone has a great idea, we can now create services that really reflect the community we are trying to serve," said Tshirki.
Tshirki is busy helping a friend back in Illinois generate the same types of reports she ran for her diocese and is also looking at other university projects that could benefit from Community Analyst. As Tshirki said, the possibilities are endless.
