ArcUser Online
Mapping Nutritional Terrain
Identifying food deserts in Lansing, Michigan
By Kirk Goldsberry and Sarah Acmoody, Michigan State University
While some parts of a city may enjoy ready access to hundreds of nutritious items, other parts of that city may have no access it all.
This article as a PDF.
A team of researchers and GIS analysts at Michigan State University (MSU) is devising new methods to identify food deserts and visualize the "nutritional terrain" of American cities at precise spatial resolutions.
A food desert is defined as an urban area with little or no access to nutritious foods. Residents living in food deserts are more likely to be overweight and have other diet-related health problems such as diabetes or hypertension. Unfortunately, these areas are both detrimental to public health and becoming more common in urban food landscapes that are increasingly dominated by fast food outlets and less well served by supermarkets and grocery stores.
As part of the nationwide Let's Move campaign, America's First Lady, Michelle Obama, has initiated a movement to eradicate America's food deserts in the next seven years. While it is clear that food deserts are an important public health problem, it is less clear how to best identify them. Before food deserts can be eradicated, they must be located. Consequently, there is an emerging need to identify nutritionally at-risk zones and visualize nutritional inequalities within cities.
Although many previous investigations of urban food environments have employed GIS, few studies have taken advantage of the more advanced capabilities of the ArcGIS suite. The MSU research team saw an opportunity to combine the abilities of intensive field data collection and the ArcGIS Network Analyst and ArcGIS Spatial Analyst extensions to accomplish two goals. The first is to quantify realistic intraurban measures of nutritional accessibility. The second is to visualize complex fresh produce accessibility patterns to reveal nutritional inequalities within urban areas. The results of this analysis can enable public health officials and legislators to better understand how the interactions of the built environment and retail food landscapes can threaten the collective nutrition of urban neighborhoods.
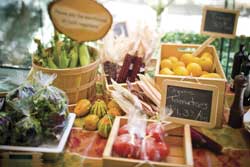
Using commercial data purchased from Esri and supplemented with Internet searches, phone book listings, and on-the-ground searches of local streets, researchers visited every local retailer that sold fresh produce in the Lansing, Michigan, metropolitan area. These sites ranged from supermarkets that carried over 200 unique produce items to convenience stores or even liquor stores that offered only one or two produce items. The team visited each location and sampled its entire produce inventory. The result was a produce geodatabase that stored the locations and produce inventories for each of the 94 produce retailers surveyed.
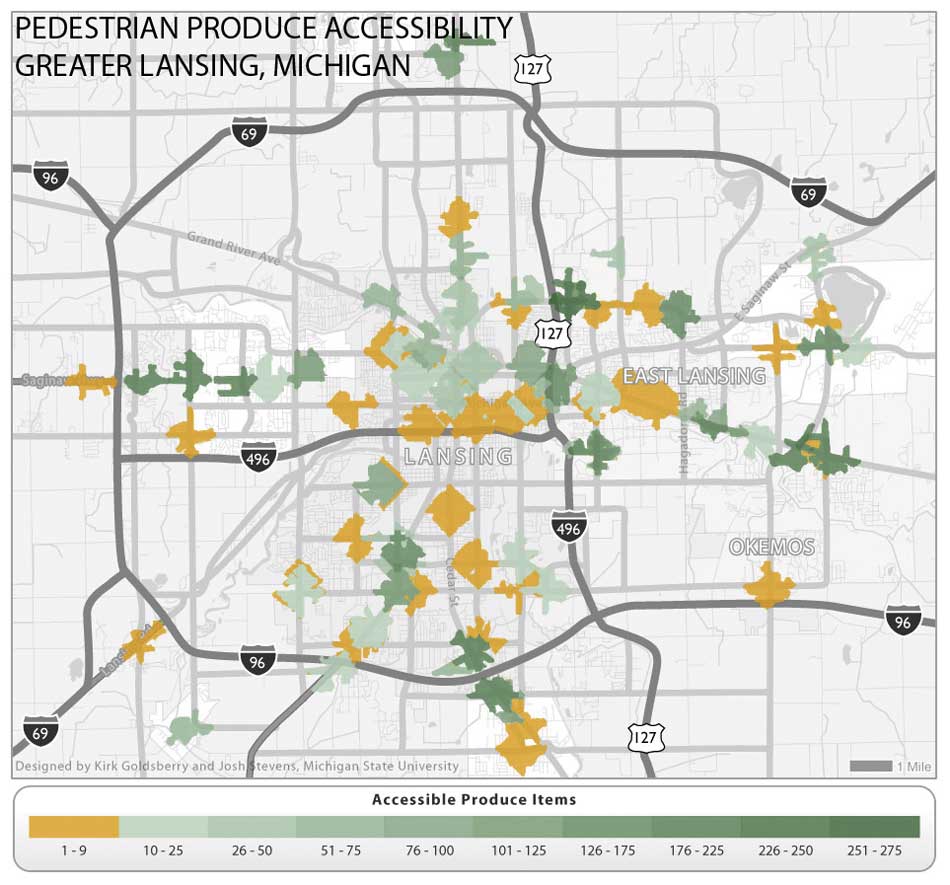
Researchers measured the number of produce items that are accessible by pedestrians given a 10-minute travel time.
Due to the diversity of retailers' inventories and the nature of the built environment, every produce item has its own accessibility signature. Prevalent produce items offered at many locations, such as bananas, serve more geographic zones than more obscure items offered at fewer locations, such as kiwis. The team used Network Analyst to model both pedestrian and automobile accessibility to each of the 447 individual produce items. The service area function within Network Analyst enabled the team to determine locations within a 10-minute journey for both pedestrians and automobiles to every produce item available anywhere in Lansing.
Individuals with access to automobiles have greater retail mobility than those who are limited to other modes of transport, especially walking. The team measured travel costs for both drivers and pedestrians in terms of estimated travel time, as opposed to Euclidean or Manhattan-block (i.e., rectilinear distance) distances.
Walking times were formulated by simply dividing the length of the optimal network route (in miles) by an average walking speed (three miles per hour). The drive cost assumed that automobile velocity on the road network was at or slightly below speed limits and assigned each road link in the study area an impedance value based on the functional class of the road (road data from Michigan Center for Geographic Information).
The researchers then calculated automobile accessibility signatures outward from retail locations. Service areas extend from a central point, which in this case is a retailer carrying a specific produce item with a specified radius (10 minutes). Portions of the service area are served and have access to the retail location, while areas that fall outside the area are not served and do not have access. By overlaying all 447 individual item accessibility layers, the team could produce a cumulative estimate of the number of unique produce items available within a 10-minute journey (either walking or driving) from any point within the study area.
The results reveal two kinds of nutritional access inequalities: general spatial inequalities and mobility-based inequalities. This analysis revealed stark spatial inequalities in produce accessibility across the metropolitan area. Some areas have abundant access to fresh produce, while other areas have little or no access. Results also reveal that these inequalities are amplified for consumers without access to automobiles. Most locations in the metropolitan area are within a 10-minute drive to scores of individual fresh produce items. However, most locations in Lansing have no produce items within a 10-minute walk. In general, pedestrian produce access appears patchy on the map. In Lansing's most densely populated areas, most people have inadequate nutritional access. Consequently, food deserts disproportionately affect individuals without automobiles.
As interest in food environments continues to increase, the role of GIS and nutritional terrain mapping should also increase. The results from this project demonstrate that GIS can help public health officials visualize the nutritional terrain and understand the complex interactions between the built environment and access to nutritious foods. Furthermore, the results indicate that while some parts of a city may enjoy ready access to hundreds of nutritious items, other parts of that city may have no access it all. Because the nutritional terrain varies considerably within an urban area, the problem must be addressed at appropriate geographic scales.
For more information, contact
Kirk Goldsberry
Assistant Professor of Geography
E-mail: kg@msu.edu
or
Sarah Acmoody
GIS Analyst, RS&GIS
E-mail: acmoodys@msu.edu

Kirk Goldsberry

Sarah Acmoody
About the Authors
Kirk Goldsberry researches and teaches geography at Michigan State University. He arrived in East Lansing in 2007 after finishing his doctorate at the University of California, Santa Barbara. Goldsberry's courses and research are focused on cartography and the graphic dimensions of GIS. More specifically, he is particularly interested in how emerging technologies, such as computer animation and GIS, can help people better understand complex geographic phenomena. His other current projects include monitoring drought in Africa, mapping health care facilities in Michigan, and improving the designs of transitions in map animations.
Sarah Acmoody is a cartographic and GIS analyst at Remote Sensing & GIS (RS&GIS) Research and Outreach, which is based on the MSU campus. Her professional focus is guiding a diverse array of clients to intelligently achieve GIS solutions. Acmoody has 10 years of experience as a GIS analyst and educator.
Michigan State University Research Team
Professors
Kirk Goldsberry, Ph.D., Assistant Professor of Geography, MSU
Chris Duvall, Ph.D., Assistant Professor of Geography, University of New Mexico
Phil Howard, Ph.D., Assistant Professor of Community, Agriculture, Recreation and Resource Studies, MSU
GIS Analysts
Sarah Acmoody, GISP, GIS Analyst at Remote Sensing & GIS Research and Outreach
Ed Bissell, GISP, GIS Analyst at Remote Sensing & GIS Research and Outreach
Graduate Students
Joshua Stevens, Department of Geography, MSU
Margaret Fitzpatrick, Department of Community, Agriculture, Recreation and Resource Studies, MSU
Meg Reed, Department of Geography, MSU
Undergraduate Students
Connor Grant, Department of Geography, MSU
Cole Smith, Department of Community, Agriculture, Recreation and Resource Studies, MSU