ArcUser Online
Simplifying Situational Awareness
Using ArcGIS Mobile to coordinate oil spill response and survey activities
By Monica Pratt, ArcUser Editor
The big difference between this event and others I have been involved in was the scale of the event and the ability to provide real time situational awareness bidirectionally.
This article as a PDF.
Response to the Deepwater Horizon incident, the largest oil spill in United States history, was aided by the most extensive deployment of field GIS for any disaster. For the first time, responders using ArcGIS Mobile had one simplified process that provided bidirectional situational awareness to all responding agencies in near real time.
On April 20, 2010, an explosion on the Deepwater Horizon oil drilling rig, under lease to BP p.l.c., killed 11 platform workers, and sank the platform, leaving the Macondo well gushing oil from the seafloor. The well, located approximately 41 miles off the southeast coast of Louisiana in the Gulf of Mexico, leaked an estimated 4.9 million barrels of crude oil before the wellhead was capped.
Response to the Deepwater Horizon incident marked the most extensive use of mobile GIS for a disaster.
An Immediate Threat
The shorelines of the states bordering the Gulf of Mexico—Alabama, Florida, Louisiana, Mississippi, and Texas—were vulnerable to the effects of the growing oil slick. The speed of wind and ocean currents, the type of oil spilled, and temperature can affect the rate at which oil spreads. However, according to the National Oceanic and Atmospheric Administration (NOAA) National Ocean Service Office of Response and Restoration, under most conditions within minutes or hours, even very heavy oil can spread until it is "as thin as a coat of paint on the wall."
The effects of an oil spill on the environment depend not only on how much and where oil was spilled and how far it has spread but also on what kind of oil was spilled. This spill involved crude oil, which can cause long-term contamination to intertidal areas and can severely impact waterfowl and mammals.
Shoreline habitat, fisheries, and wildlife in states bordering the Gulf of Mexico were immediately threatened by the spill. Previous accidental oil releases in the Gulf have directly impacted blue crabs, squid, shrimp, and other commercially important aquatic life as well as wildlife that can be adversely affected by direct contact with oil.
Populations of some wildlife species in the area were under pressure before the spill. For example, all five species of Gulf Coast sea turtles are listed as threatened or endangered. To prevent the loss of all this year's hatchling sea turtles, the U.S. Fish and Wildlife Service (USFWS), NOAA's National Marine Fisheries Service (NOAA-Fisheries), and the Florida Fish and Wildlife Conservation Commission (FWCC) jointly developed a plan that is relocating 700 sea turtle nests.
Of the many species endangered by the oil spill, the situation of the Brown Pelican is particularly poignant. The Louisiana state bird, Pelecanus occidentalis had just made a remarkable comeback from near extinction as the result of widespread use of the pesticide DDT in the 1950s and 1960s and habitat pressure caused by the erosion of wetlands. In November 2009, it was taken off the endangered species list. After the spill, birds were again endangered by the volatile compounds in oil that can cause respiratory and digestive ailments, particularly in young pelicans.
While dead and dying sea turtles and pelicans vividly illustrate the effects of direct contact with oil, other effects from oil spills are less apparent and more long term. Toxins in oil can cause genetic damage, liver disease, cancer, and reproductive and developmental conditions that impair fish and other animals. Soil in areas where plants die from exposure to oil can become destabilized, leading to erosion. Effects on animals can also result from compromised habitat, altered migration patterns, decreases in available food, and life cycle disruption.
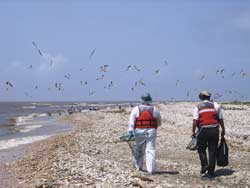
U.S. Fish and Wildlife staff used the application to document oiled birds and other species recovered.
The spill also endangered the economic well-being of the human residents of these states, an area still recovering from the devastating effects of Hurricanes Katrina and Rita in 2005. Oily coastal waters and beaches threatened two major industries in the region: commercial seafood and tourism. The Gulf supplies the nation with crab, shrimp, oysters, and crawfish, while the tourist and recreation industry employs hundreds of thousands of area residents.
Urgent Response Required
To minimize these adverse effects, rapid response to the oil spill was essential. A unified command was established to manage response operations and link responding organizations. Fifteen federal agencies, including NOAA, the U.S. Environmental Protection Agency (EPA), the U.S. Coast Guard, and the Department of Homeland Security were involved in response along with numerous state and local agencies from the five states bordering the Gulf. Thousands of vessels and tens of thousands of personnel have been involved in the Gulf response and mitigation efforts.
Esri's disaster response team was providing assistance—software, technical support, GIS data, and personnel—to local,state, and federal government agencies as well as private-sector organizations. (For more information on other aspects of Esri's involvement, see "GIS Used to Respond to Oil Spill Disaster: Esri Provides Software, Services, and Around-the-Clock Support." Esri also created an interactive social media map application that not only showed the current location of the oil spill but also let visitors add links to online photos, Web sites, and YouTube videos related to the spill.
Mobile GIS Added to Response Efforts
While BP was convinced that a mobile solution could help coordinate these efforts, it was not confident that communications could be adequately handled over a five-state area. Esri wildland fire specialist Tom Patterson, a member of Esri's response team who has been using mobile GIS for emergency response since 2000, was sent to support mapping of the oil slick's impact on the environment and coordinate mitigation efforts using mobile GIS.
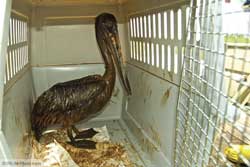
Oily pelicans were captured and transported to rehabilitation centers so wildlife biologists could work on them.
Although cellular connectivity was now available in much of the deployment area, Patterson knew wireless communication would be essential to effectively carry out both missions. He also knew that Inmarsat's Broadband Global Area Network Service (BGAN) had been used in Haiti disaster relief efforts. He took a BGAN terminal supplied by Inmarsat service provider Remote Satellite Systems. The terminal accessed the BGAN mobile service, which provides simultaneous voice and broadband data capabilities.
Esri staff, called in to support the federal incident command post at Houma, Louisiana, created a focused ArcGIS Mobile application for mapping oil barricades. After an initial proof-of-concept phase, BP purchased 300 Trimble handheld devices for use in spill response. Patterson conducted brief training sessions for the Louisiana National Guard, U.S. Coast Guard, and U.S. Fish and Wildlife response teams that would be using the mobile units and ArcGIS Mobile application. Field teams used BGAN to synchronize data with Esri's servers in Redlands, California.
Protecting Vulnerable Shoreline
After it was clear the oil spill could not initially be stopped, Louisiana's governor Bobby Jindal called out the Louisiana National Guard to protect sensitive species habitat. When dealing with the oil from spills, responding agencies have three strategies: contain it using barriers; disperse it with the help of chemical products; and remove it from the water through burning, filtering, and/or collecting oil.
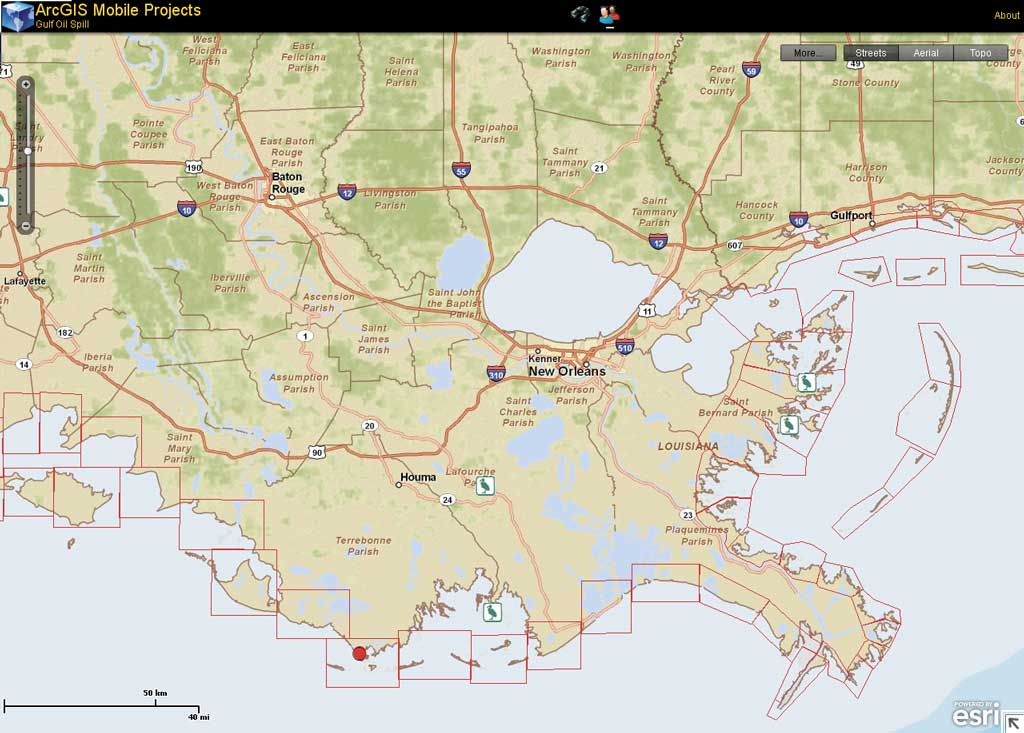
This operations map shows the division boundaries established on along the Louisiana coast.
The Louisiana National Guard was tasked with placing booms that would contain, deflect, and hold back the growing oil slick. Booms are tubular floating barriers that can be made of porous material to absorb as well as contain oil. In addition to booms, sandbags, and HESCO baskets (deployable jetty structures made of mesh front and filled with rocks) were put in place by the guard.
Planners and incident commanders needed access to current information on the type and location of the barriers being deployed along the beaches in various counties and parishes to stop oil from reaching the shore. This was a formidable task, given the Gulf's approximately 47,000-mile U.S. coastline (a figure that includes the shores of barrier islands, wetlands, inland bays, and inland water bodies that was developed using mean high water line digitized from NOAA's nautical charts). As of the end of August, approximately 1.81 million feet of containment boom and 9.16 million feet of sorbent boom had been deployed.
Response crews from various federal and state agencies and teams within BP used mobile units and ArcGIS Mobile to collect data about the location and condition of booms and other barriers. The Alabama Marine Police used Panasonic Toughbooks mounted in their boats to map booms that had been deployed. Subsequently, booms were mapped as they were being deployed, eliminating the need to revisit sites.
Using the BGAN network, maps, data, images, and video were transmitted to Incident Command. This gave command staff a very high level of situational awareness. They could view information on the placement of barriers in near real time. In addition to monitoring where barrier devices were being placed, the mobile data collection also helped with staffing because the information on the personnel deployed was so current and widely available.
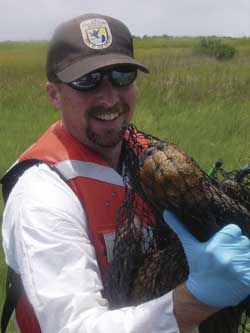
Jim Hawkins of USFWS holds a rescued pelican that will be sent to a rehabilitation center.
Recording Survey Information
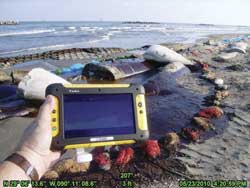
Areas contaminated by oil spills are surveyed to determine the best response strategies. That survey information is gathered by Shoreline Cleanup and Assessment Technique (SCAT) team members who record this information on standard SCAT forms. Esri's ArcGIS Mobile team created a data model for the short version of the SCAT form for use by responders with GPS-enabled handheld mobile devices.
The intelligence in the data model was directly leveraged through an application developed in a prerelease version of ArcGIS Mobile 10. Responders could use the GPS capabilities of the mobile device to capture segment lines and zone points. The application was used to fill out a form that meets SCAT specifications and transmit this data to the command center via a wireless connection. Simple to deploy, the application was well received and required little or no training for the responders using it.
USFWS staff used the application to document oiled birds and other species recovered in Louisiana marshes. Pelican rescue efforts were representative of these activities. Approximately 15 to 18 oily pelicans were captured every day and transported to rehabilitation centers so wildlife biologists could work on them. As of mid-July, 681 pelicans had been rescued. Mapping the locations where pelicans were captured updated previous wildlife surveys, identified breeding areas, and supplied baseline data for comparing the recovery of the species in succeeding years. After cleanup, healthy birds were released in Florida, Texas, and western Louisiana.
A Breakthrough
"The big difference between this event and others I have been involved in was the scale of the event and the ability to provide real-time situational awareness bidirectionally," said Patterson, who has been involved in public safety for more than 30 years.
In previous response efforts, GPS units were used for collecting locations. That information had to be uploaded somewhere separately later and incorporated into a map, then pushed out or printed to update other people in the effort. "The ArcGIS Mobile solution is seamless and immediate," he said.
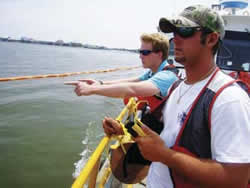
Response crews from federal and state agencies and teams from BP used mobile units and ArcGIS Mobile to collect data on the location and condition of barriers.
Although ArcPad 8 allows updating of the server from the field, it is designed for knowledge users who are conducting ad hoc projects. ArcGIS Mobile was selected because it was a simpler solution that allowed one application to be used for multiple projects. ArcGIS Mobile can be customized with extensions tailored to the needs of each responding agency. These applications can be configured to monitor field-workers, enforce validation on fields, attach cabinet (CAB) files and photos to reports, and post data automatically back to the server.
With ArcGIS 10, "We could sync from anywhere using the BGAN network," said Patterson. The Spatial Flex viewer, an out-of-the-box solution that comes with ArcGIS Server, was used for displaying current maps at daily briefings. The ability of everyone in a five-state area to see the same information at the same time was a big advancement. With the combination of ArcGIS Mobile and BGAN, these capabilities can be supplied in one simplified process.
Patterson believes these new capabilities have important implications for emergency response efforts. Because real-time information about the incident can be made available to everyone working on an event, they can interact as needed, not just at daily briefings. The 12-hour cycle for incident control can be modified and a new paradigm adopted that keeps options open and increases the potential for better decisions and more effective response.
Extending the Role of Mobile GIS
For many years, GIS has played a pivotal role in disasters like the Gulf of Mexico oil spill. Remediation efforts for one of the most well-known accidental oil releases, the 1989 Exxon Valdez spill, were aided by GIS. This technology has played a key role in managing and analyzing data for oil spill restoration projects.
With the introduction of ArcPad a decade ago, ArcGIS was expanded to include the mobile platform, which has been especially valuable to emergency management. With ArcPad, GIS professionals and trained volunteers involved in emergencies could access and collect georeferenced data in the field using GPS-enabled handheld devices.
However, the use of ArcGIS Mobile in the Deepwater Horizon incident represents a milestone in the extension of GIS in the field. Simple, focused applications that were rapidly deployed and centrally maintained let responders from the Louisiana National Guard, USFWS, and other agencies immediately and rapidly gather georeferenced data with little or no training. With the addition of BGAN, which supplied wireless connectivity, information on the rapidly evolving event was quickly and easily shared with all agencies involved, helping organize protection and cleanup efforts and providing a common operational picture in near real time.