ArcUser Online
Is Renewable Doable?
Atlas shows energy opportunities at local level
By Barbara Shields, Esri Writer
The overall objective for the Renewable Energy Atlas of Vermont was to build intelligence into the modeling process for each renewable energy layer.
This article as a PDF.
A nonprofit organization based in one of the smallest states in the United States has taken on a very big challenge: making renewable energy viable. Its Web site encourages people to get involved in localizing energy production and provides justification for community projects that retain jobs and help stabilize the economy.
The Renewable Energy Atlas of Vermont (www.vtenergyatlas.com) is an interactive Web site that lets people identify, visualize, and analyze data about existing and promising renewable energy opportunities for any town or county in Vermont. The atlas was initiated by Vermont Sustainable Jobs Fund (VSJF), a nonprofit organization created by Vermont's legislature to accelerate the development of the state's green economy. VSJF provides early stage grant funding and technical assistance to develop markets for sustainably produced goods and services (e.g., renewable energy, local food systems). Built on Esri's ArcGIS technology, the atlas makes it possible for people to access data about biomass, geothermal, hydroelectric, solar, and wind resources and use GIS to view existing and potential projects by area.
"Energy is the key variable for transitioning toward sustainability," said Scott Sawyer, research, evaluation, and communications coordinator at VSJF. "We were looking for a way to show people how renewable energy flows through their communities so they can see the options for harnessing it. The Web site lets them zoom in to a town or subtown level and look at the area's renewable energy and efficiency possibilities. Our goal was to make the Web site easy and fun."
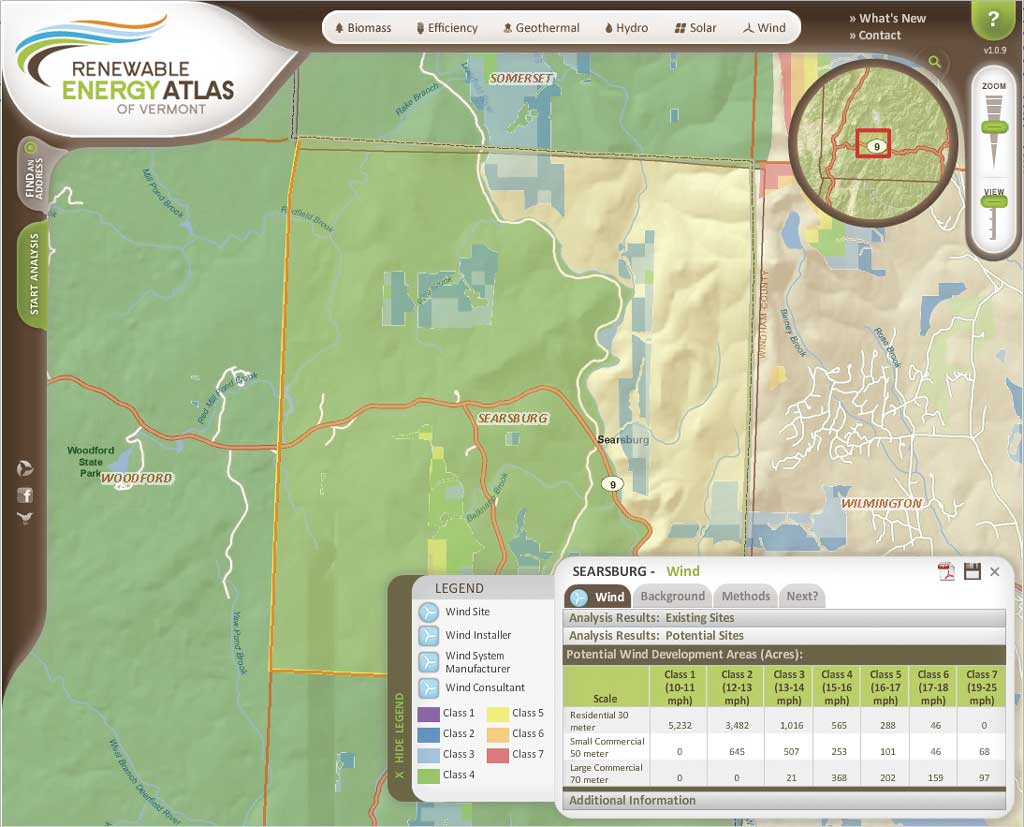
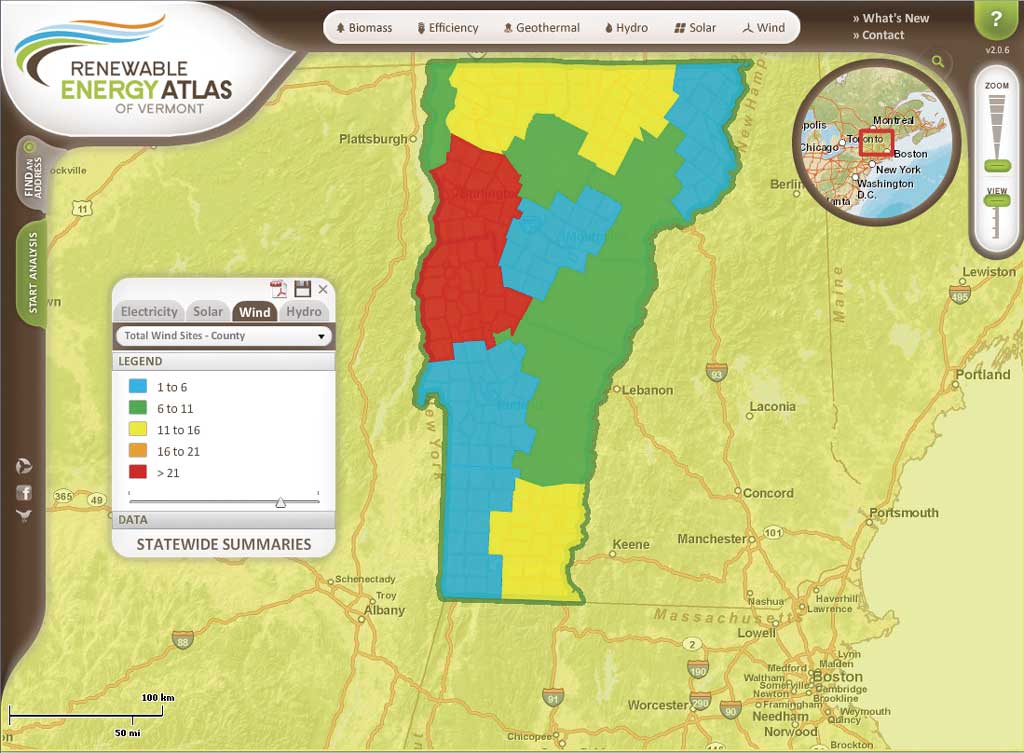
Each energy type required specific interfaces for summarizing and displaying the results of the analysis of potential sites. The wind energy interface provides information on sites, installers, manufacturers, and consultants as well as energy potential.
Robust GIS technology, good data, engaging Web design, and easy-to-use applications made this possible. Since its launch in April 2010, the site has received thousands of visitors. Other states have taken note of the site as well. For example, the Alaska Energy Authority is interested in building a similar tool.
Looking for Viable Renewable Options
Vermont is a small state with a "green" reputation. The state name means "green mountain." It is a state of lush forests, lakes, and rivers. Vermonters are passionate about ecology and work actively to build a sustainable future. Despite Vermont's green reputation, the state is as dependent on nonrenewable energy sources—fossil fuels and an aging nuclear reactor—as the rest of the nation. The pressing need to cut energy costs has led to a grassroots response to foster renewable energy generation and lessen the state's contribution to global warming. Of Vermont's 255 towns, more than 100 now have energy committees. Vermonters want to know where renewable resources exist and what they can do to utilize them. This sentiment was the impetus for the Renewable Energy Atlas of Vermont.

Choose biodiesel and the site displays feedstocks. Selecting oilseed crops shows agricultural soils suitable for growing oilseed crops and an analysis that shows the energy potential for a source.
How It Works
Atlas visitors start by selecting an area and an energy option. Choose a biodiesel selection and the site displays three subcategories: oilseed crops, waste vegetable oil, and potential algae-to-biodiesel locations. Selecting waste vegetable oil will show the user the locations of all the restaurants that generate waste vegetable oil. Selecting oilseed crops will show agricultural soils suitable for growing oilseed crops. Another panel shows the results of analysis of the energy potential for a source. For example, these results might show the number of gallons of biodiesel fuel an acre of sunflowers could produce. Choose the solar option and specify the photovoltaic option, and the incoming solar radiation is modeled for nearly every building in the state. End users can tailor the information to the specifics of their site (e.g., photovoltaic (PV) system size, roof pitch) to arrive at an estimate of annual electricity output.
How It Was Made
Collecting, organizing, and analyzing data, as well as developing the Web interface for this project, was a sizable undertaking. It took the better part of two years from initial conceptualization to final Web site. VSJF worked with the Vermont Center for Geographic Information (VCGI) on the project. During the past 25 years, VCGI has been operating a clearinghouse, developing statewide geographic base layers, and providing GIS services to state agencies and local government.
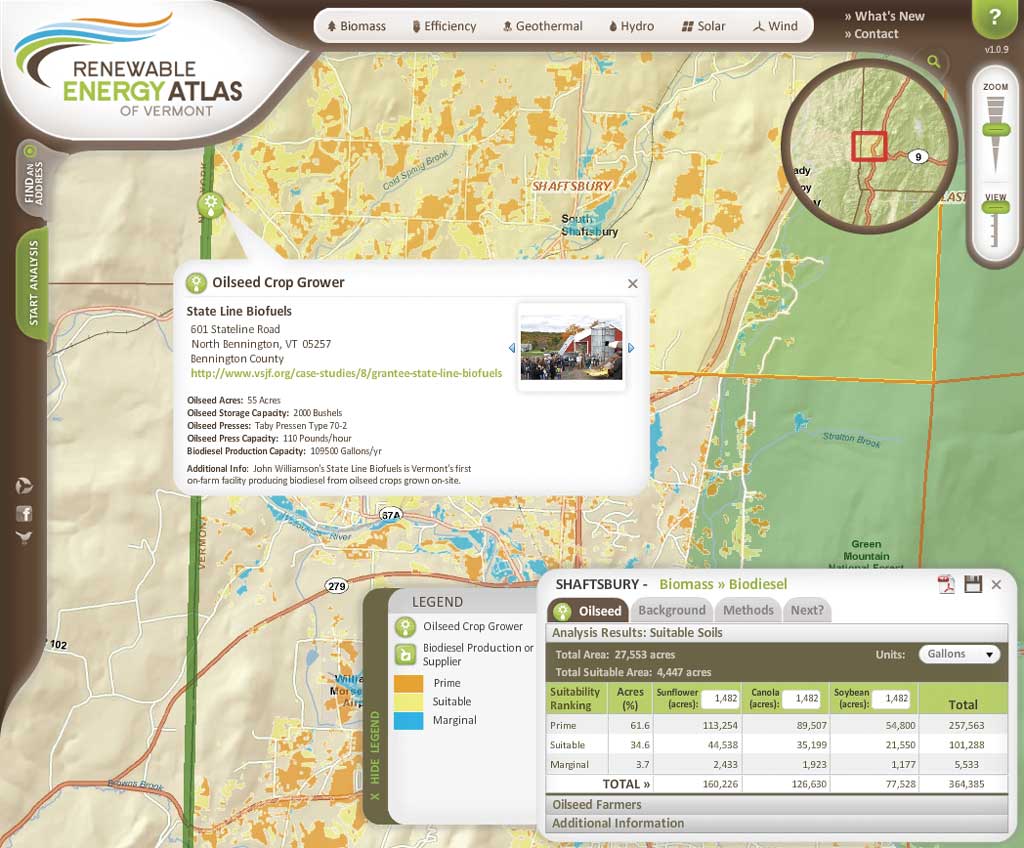
The atlas features agricultural soils suitable for growing oilseed crops
Mike Brouillette, a VCGI senior GIS project manager, worked with VSJF to compile, model, and analyze the GIS data necessary for the project. "The overall objective was to build intelligence into the modeling process for each renewable energy layer that reflects the best overall public good for each resource site," he said. "Datasets for the major renewable energy options—biomass, efficiency, geothermal, hydroelectric, solar, and wind—were further broken down into multiple categories of data for specific renewable energy analysis. For example, the biomass option includes data for biodiesel, perennial grasses (i.e., grass pellets), methane digesters, waste to energy, and woody biomass." VCGI worked with a wide range of experts in Vermont to identify and modify existing datasets, model new ones, and develop a methodology for each energy layer.
Once developed, these layers were further processed through a suitability framework that balanced the raw renewable energy resource with a myriad of practical considerations relating to conservation, ecology, natural resources, and recreational activities. This framework screens out areas, such as rare and threatened species habitat or areas abutting rivers, lakes, and wetlands, that are unsuitable for development. It assigns rankings or relative suitability values to the remaining areas. These values can reflect the volume or quality of the raw resource, as well as societal values relating to a specific natural resource.
To build functionality for the atlas, VSJF contracted with Fountains Spatial, a leading provider of GIS services such as application architecture design and development, data design, training, and hosting. Fountains Spatial designed a leading-edge service-oriented ArcGIS Server-based architecture that included ArcGIS Online services and an interface developed using the ArcGIS API for Flex.

These sunflowers are grown at John Williamson's State Line Farm, Vermont's first on-farm facility making biodiesel made from oilseed crops grown on-site. With on-farm energy production, Vermont farmers can develop new value-added revenue sources (e.g., organic, local livestock meal), reduce on-farm expenditures and greenhouse gas emissions, ensure their energy security, and circulate money locally.
"VSJF had some pretty high standards for this Web site," explained Peter McAlenney of Fountains Spatial, who managed the programming and interface design for the project. "They wanted the site to stand out and have a unique look and feel that breaks away from standard Web mapping applications. We raised the bar and, in so doing, faced challenges in building the look and feel of the user interface."
For this application, Fountains Spatial provided the ability to analyze, to varying degrees, more than 20 different renewable energy types. McAlenney said they looked at the approach used by the Boston Solar Web site, which provides a simple but powerful application for looking at solar potential in the Boston area. This approach inspired their own approach to modeling solar potential and the other renewable energy types.
"However, each of the various energy types is unique, and we needed to provide a wide range of interfaces for summarizing and displaying results," said McAlenney. "A wind power analysis is quite different than evaluating potential production of biodiesel from canola seeds. Designing these interfaces was one of the great challenges in developing the atlas."
In the project design methodology, Fountains Spatial documented analysis workflows from start to finish as well as key business logic. The team created ArcGIS Server map services (for cartography) and geoprocessing services (for analysis) consuming the geodatabase provided by VCGI. Basemaps were mashed in from ArcGIS Online. (ArcGIS Online is a common platform where ArcGIS users can directly connect to maps, layers, tasks, and tools published by Esri and other ArcGIS users.)
The team authored maps and created the geoprocessing tools for running calculations and performing other tasks in ArcGIS Desktop and published maps and tools to ArcGIS Server. The client front end and related business logic were implemented using the ArcGIS API for Flex and Flex Builder. The design team included video tutorials on the site's help system and a content management system-driven information clearinghouse so atlas users can access additional information such as photos and text.
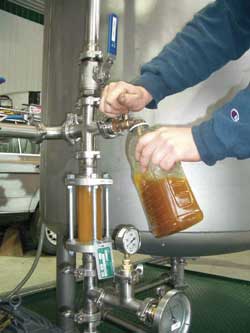
Oilseeds are crushed and the resulting oil is converted into biodiesel.
"Esri's service-oriented architecture, including ArcGIS Server and ArcGIS Online, is fantastic," said Mark Haberle, senior project manager at Fountains Spatial. "It has provided us with the ability to consume massive amounts of free data and advanced services from ArcGIS Online. The system architecture allowed us to then layer our own raster and vector data over these map services. In turn, these were then mashed together with ArcGIS Online geocoding and locally published geoprocessing services providing deep cartographic and analysis capabilities."
These services, coupled with the rich Flex API, allowed Fountains Spatial to build engaging, interactive, and powerful analysis tools and develop a creative, forward-thinking interface design that makes the Web site easy to use and provides a unique experience. "Using the Esri suite of technologies made this process seamless. Specifically, ArcGIS Online has been very efficient for us. We did not need to build out any kind of basemap or geocoding services. You can't beat that," said Haberle.
Conclusion
"Our hope," said Sawyer, "is that the atlas will assist town energy committees, funders, educators, planners, policy makers, and businesses in making informed decisions about renewable energies in their communities. These decisions will ultimately lead to successful projects, greater energy security, a cleaner and healthier environment, and better quality of life across the state."
Learn More at These Web Sites:
Esri recognized the outstanding work of VSJF on the Renewable Energy Atlas project with a Special Achievement in GIS Award, which was presented at the 2010 Esri International User Conference.
About the Author
Barbara Shields is an Esri writer dedicated to sharing environmental GIS stories. She is the editor of Environmental Observer and Forestry GIS Journal, two Esri newsletters.