ArcUser Online
Locating Sites for Photovoltaic Solar
Pilot study uses DEM derived from LiDAR
By Andrea Chaves and A. Terry Bahill, University of Arizona, Tucson
This article as a PDF.
State governments are challenging electric companies to increase the utilization of renewable energy sources. According to the Database of State Incentives for Renewables and Efficiency (DSIRE), 29 states have renewable energy standards that establish requirements for increasing renewable energy usage, and nine states have renewable energy goals. Arizona is one of those states. The Arizona Corporation Commission Renewable Energy Standard (RES) requires that 15 percent of Arizona's retail sales be derived from renewable sources by 2025.

Flowchart showing the selection process
According to the United States Energy Information Administration, Arizona is one of the states with the greatest solar photovoltaic (PV) resource potential in the country; however, finding suitable locations for large-scale solar farms is difficult due to zoning and other restrictions. Regulations imposed by state and federal agencies, such as Arizona Game and Fish and the United States Bureau of Land Management, significantly reduce the areas that can be utilized for solar energy production. [These regulations were implemented to avoid, minimize, or mitigate habitat loss, habitat fragmentation, and other negative impacts associated with the development of large solar energy generating facilities.] Given these restrictions, a GIS was designed to analyze the rooftops in developed areas and determine suitable locations for solar panels.
Determining the Study Area
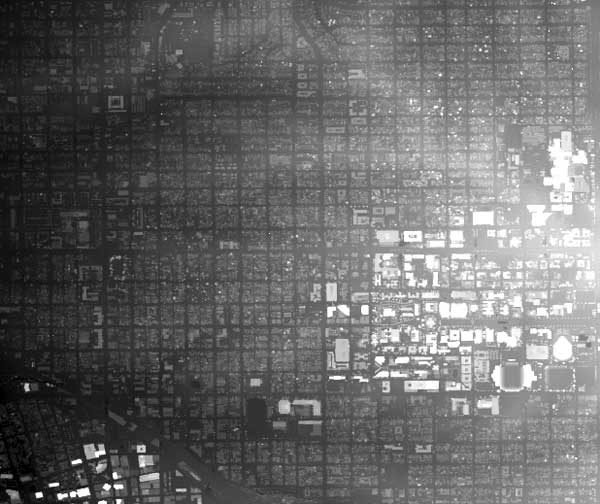
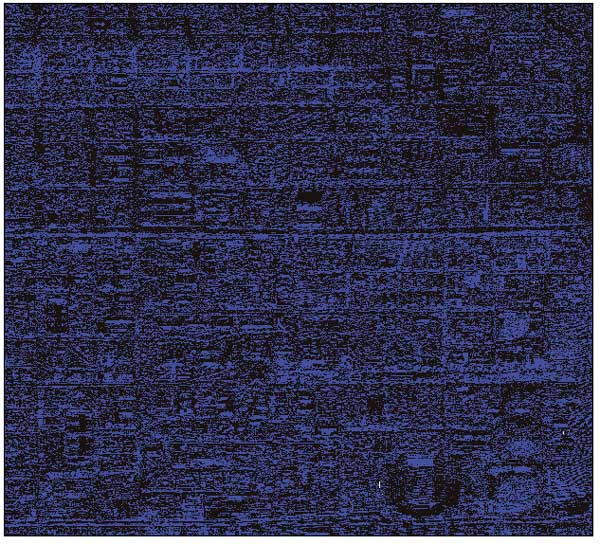
The pilot study analyzed four square miles surrounding the University of Arizona in Tucson. Original data for the area of this pilot study was obtained from a light detection and ranging (LiDAR) image provided by the Pima Association of Governments (PAG). The image depicts the area surrounding the University of Arizona that contains residential development, commercial development, university buildings, open areas, and athletic fields.

ModelBuilder model for generating feasible aspect and elevation rasters
A digital elevation model (DEM) was derived from the LiDAR data and was saved in ArcGIS as a floating-point raster image. Because the DEM was not georeferenced, the raster was georeferenced using the Georeferencing toolbar in ArcGIS. The resulting dimensions and point locations of the georeferenced image were verified using several points with known locations.
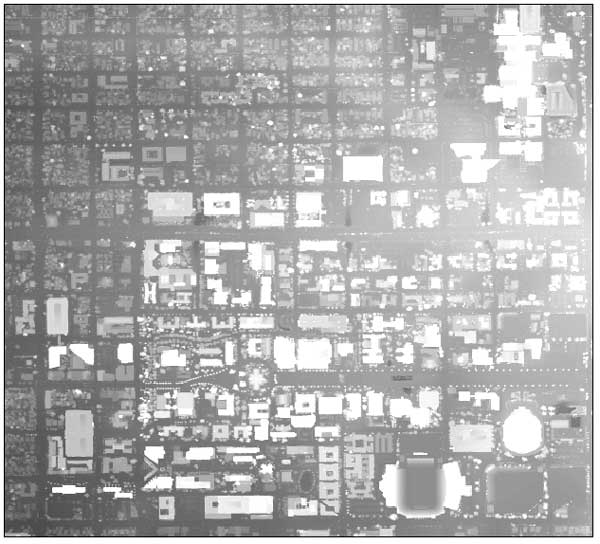
Generating a Solar Map
Using the Area Solar Radiation Tool in the ArcGIS Spatial Analyst extension, a solar map was generated from the georeferenced image specifying Tucson's latitude of 32 degrees and a yearly interval. This solar map takes into consideration the changes in the elevation (azimuth) and position of the sun, as well as any shading effect caused by buildings or other objects in the input raster.
Determining the Desired Characteristics of a Suitable Location
Suitable locations for solar panels have specific characteristics and requirements. Identifying those locations requires that desirable characteristics be defined. For this study, suitable sites should have these characteristics:
- Suitable elevation—The location must be on top of a building. (It should not be at ground level.)
- Suitable aspect—The aspect should be south facing or horizontal. (Because Tucson is located in the northern hemisphere, solar panels located on south-facing slopes will have a higher solar power output than those located on north-facing slopes.)
- Suitable slope—The slope should be less than 35 degrees.
- High radiation—The site should receive, on average, at least some minimum amount of solar radiation per year. That amount is determined by the analyst.
In general, the goal is to find rooftops that face south or are flat and have a slope that is not too steep for installing solar panels. The site should receive at least some minimum threshold of solar radiation each year. This last constraint eliminates sites located next to taller buildings that block sunlight for a significant portion of the day.
Model for determining the number of panels
Filtering Unsuitable Locations
Using ModelBuilder, masks were generated to select locations that had these desirable characteristics and met the project requirements.
Ground mask
A bare-earth file was generated from the LiDAR data and georeferenced to the same coordinates as the input image. A binary ground raster was generated that identified nonground cells by assigning a value of 1 for any cell greater than or equal to the bare earth value plus five feet and assigning 0 to all others, which were ground cells.
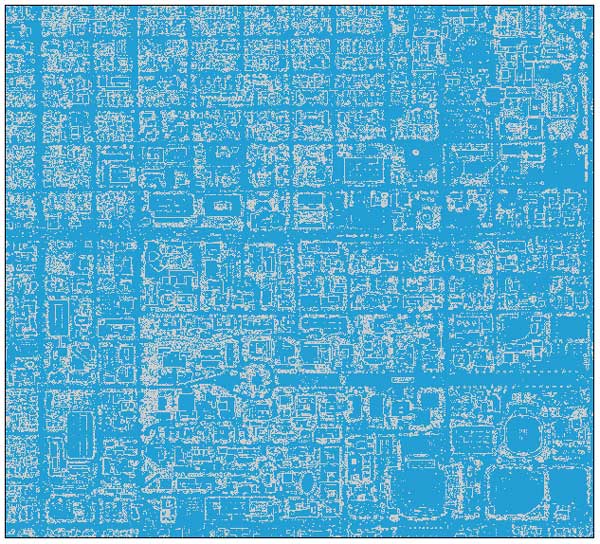
Aspect mask
An aspect raster was generated from the georeferenced image. From this new aspect raster, a binary aspect raster was created by selecting all the cells that had south, southeast, southwest, or flat aspects and assigning them a value of 1. A low-pass filter was used on the georeferenced image to generate a smoother aspect raster and facilitate the analysis of the final output of the GIS.
Slope mask
The slope mask was generated in a manner similar to the aspect mask. Using the filtered georeferenced image as an input, a binary raster was created by selecting all cells with a slope less than or equal to 35 degrees and assigning those cells a value of 1.
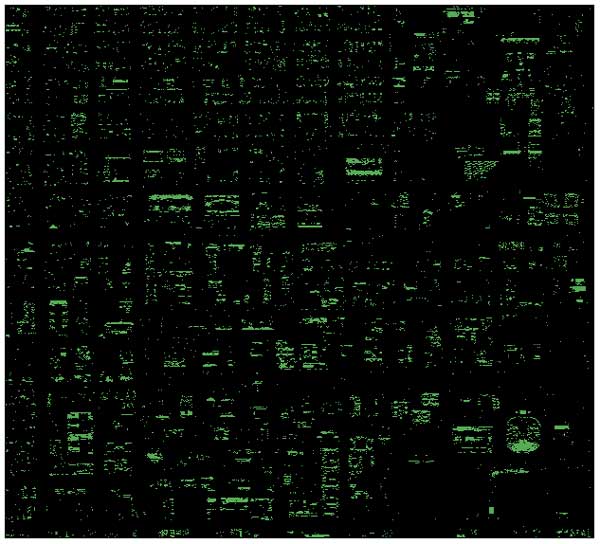
Radiation mask
A minimum radiation threshold was selected based on the desired power output. Once again, a greater-than conditional block was used to generate a binary raster. Cells equaling or exceeding the threshold value were assigned a value of 1.
Human mask
A human using knowledge of the area, maps, and visual inspections can eliminate undesirable sites (e.g., the area outside the president's office window; athletic stadium seats; roofs with pipes, air conditioning units).
ModelBuilder model for generating the final result
Finding Suitable Locations
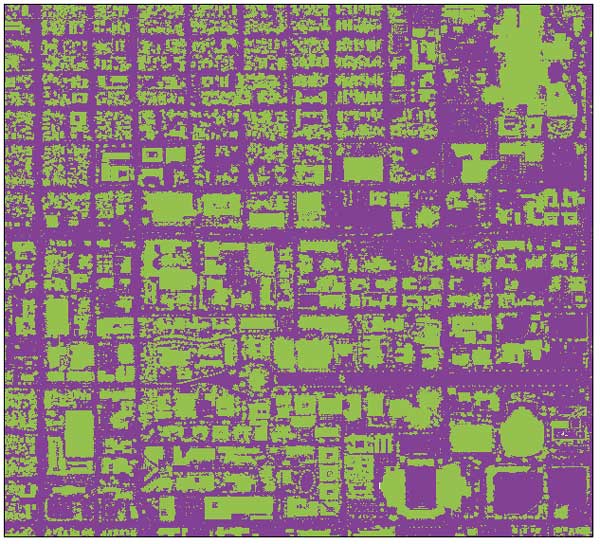
To find feasible locations for the solar panels, all the binary rasters were combined into a final raster that takes a value of 1 for locations that meet all conditions and 0 for those that do not.
This algorithm was converted into ModelBuilder to automate the output generation process. The model uses six main inputs: the DEM, the aspect raster, the slope raster, the radiation raster, the bare earth raster, and the analyst mask.
Analyzing the Results
The output generated using the five masks was input for the Raster To Polygon tool that generated polygons for all the suitable areas. Polygon areas were calculated and added to the attribute table using ModelBuilder.
One-and-a-half square meters was used as the required area for each solar panel. This requirement was based on the size of the solar panels most commonly used at the Tucson Electric Power solar panel test yard with a 15 percent buffer to accommodate the mounting frame and additional spacing. The number of solar panels that could fit in each polygon was estimated by using the following formula:
Polygon_Area/Solar_panel_size
Because inverters and other hardware required to connect solar panels to the grid are expensive, the theoretical number of solar panels that can fit in each area can be used by the analyst to select only those locations that can fit at least a predetermined number of solar panels.
Filtering Unsuitable Locations
|
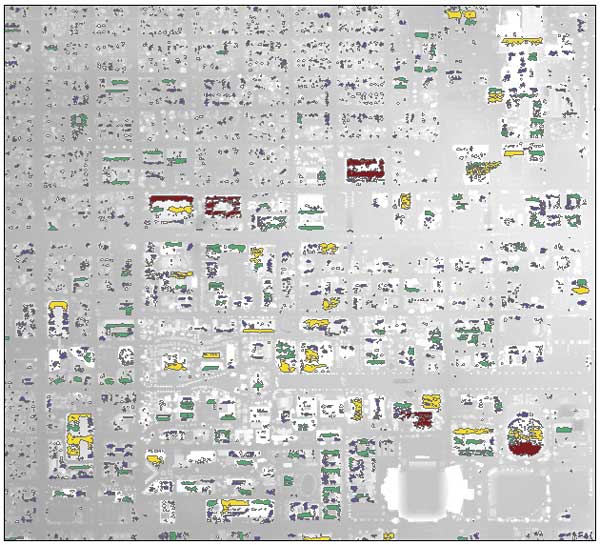
The output generated using the five masks was used as input for the Raster To Polygon tool that generated suitability polygons. These polygons were symbolized based on the theoretical number of solar panels that could fit in each polygon.
When the Raster To Polygon tool was used, a very large polygon that consisted of the perimeter of the image was created. This polygon has no relation to suitable solar panel locations and could not be included in the analysis. To eliminate this issue required a two-step process. First, a Max field was added that contains the maximum allowable polygon size in square meters. This value is dependent on the size of the analysis area. In this case, the site had an area of four square miles, so the maximum polygon size was set at nine million square meters. Second, every row that has an Area field value larger than the Max field value is selected and deleted from the table.
This model is a good tool for determining the sites suitable for PV solar panels. However, it should be developed further so the decision- making process can consider factors such as PV panel and inverter costs, return on investment, and engineering concerns.
Acknowledgments
The authors thank professors Guzin Bayraksan, Young-Jun Son, and Ferenc Szidarovszky for their guidance; Tim Cloninger for GIS advice; and Manny Rosas of PAG for the LiDAR data.
For more information, contact
Andrea Chaves at chaves.andrea@gmail.com
or Terry Bahill at terry@sie.arizona.edu
About the Authors
Andrea Chaves currently works as a business technology analyst at Deloitte Consulting LLP in Denver, Colorado. She earned a bachelor's degree in industrial engineering, a master's degree in management with emphasis in finance, and a master's in industrial engineering, all from the University of Arizona, Tucson. In 2008, she was a recipient of the Wayne Wymore Award for excellence in systems and industrial engineering and was named outstanding senior for her graduating class. During her graduate studies at the University of Arizona, she worked as a teaching and research assistant in areas such as production planning, forecasting, and optimization; probability and statistics; and systems engineering. In her spare time, she enjoys triathlons.
A. Terry Bahill is a professor of systems engineering at the University of Arizona, Tucson. He received his doctorate in electrical engineering and computer science from the University of California, Berkeley. Bahill has worked with BAE Systems; Hughes Missile Systems; Sandia Laboratories in Albuquerque, New Mexico; Lockheed Martin Tactical Defense Systems; Boeing Information, Space and Defense Systems; the Idaho National Engineering and Environmental Laboratory; and Raytheon Missile Systems. For these companies, he presented seminars on systems engineering, worked on system development teams, and helped them describe their systems engineering process. He is a fellow of the Institute of Electrical and Electronics Engineers (IEEE), of Raytheon, and of the International Council on Systems Engineering (INCOSE) and the Founding Chair Emeritus of the INCOSE Fellows Selection Committee. He holds a U.S. patent for the Bat Chooser, a system that computes the ideal bat weight for individual baseball and softball batters. He received the Sandia National Laboratories Gold President's Quality Award.