ArcUser
Fall 2012 Edition
Extending GIS without Extending Your Day
Your life as a GIS manager just got a little easier.
By Monica Pratt, ArcUser Editor
This article as a PDF.
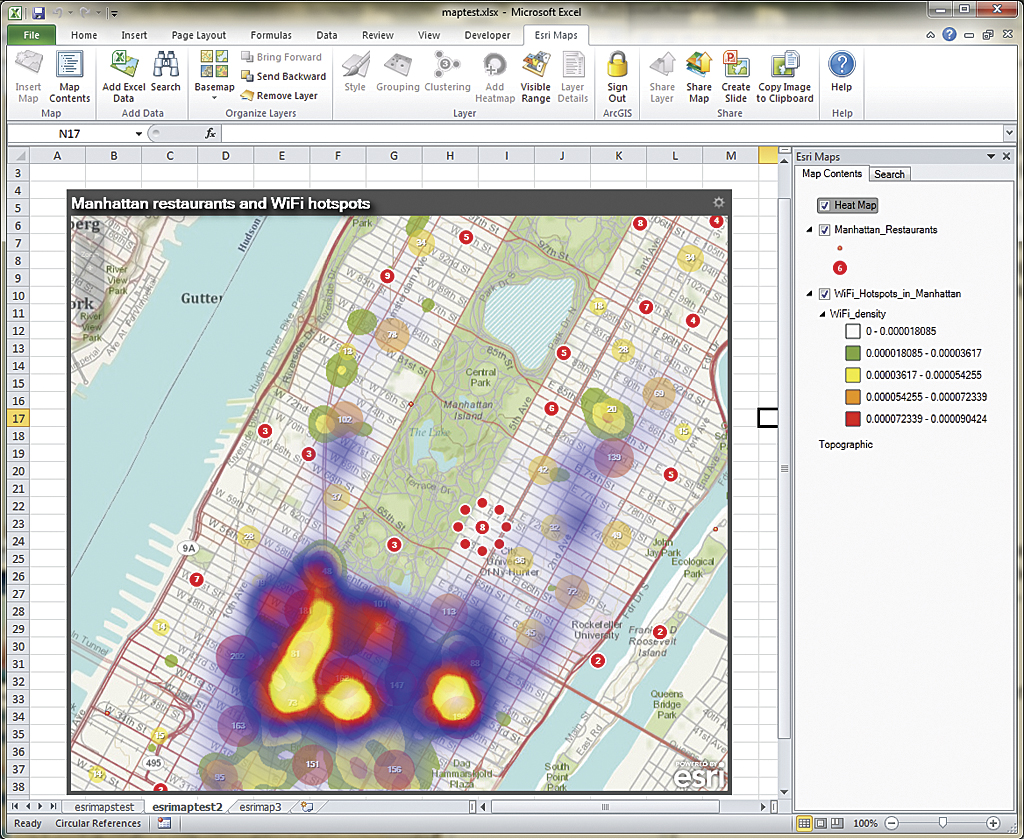
Dynamically clustering points aggregates points as a single symbol at a small scale that can be broken apart when selected. At larger scales, points are displayed as individual symbols.
With Esri Maps for Office, your organization's non-GIS staff can map their own tabular data and incorporate the map and feature services your department creates and maintains on ArcGIS Online for Organizations without leaving the comfortable and familiar confines of Microsoft Office.
Dealing with Mission Creep
As a GIS manager, your mission is to geoenable your organization. This means you are responsible not only for supporting the people who build, manage, and maintain your organization's GIS but also the customers in your organization who use geospatial intelligence to inform decisions and improve workflows.
As the value of GIS has been recognized, its role has expanded from a tool to accomplish specific projects to an enterprise-wide information framework. In the process, the focus has shifted from making data available to providing actionable information to the organization. As a result, many GIS departments not only directly help individual customers but have developed strategies that let customers help themselves. Esri Maps for Office is a leap forward in this second process.
With 500 million users, Microsoft Office is likely the most used software in your organization for both presentation and analysis. Microsoft PowerPoint presentations are a staple of both conferences and staff meetings. Business professionals rely on Microsoft Excel for calculating, aggregating, manipulating, and graphing all kinds of data.
Although much of this data contains geographic information in the form of addresses, place-names, or coordinates, there was no way to visualize and analyze using location until now. With the Esri Maps for Office add-in, decision makers and managers can add location to their analysis and presentations without changing the way they work. It will make patterns in the data visible that graphs, charts, and tables cannot reveal. Interactive maps add impact to PowerPoint presentations and can be shared via web pages, mobile applications, and ArcGIS Online.
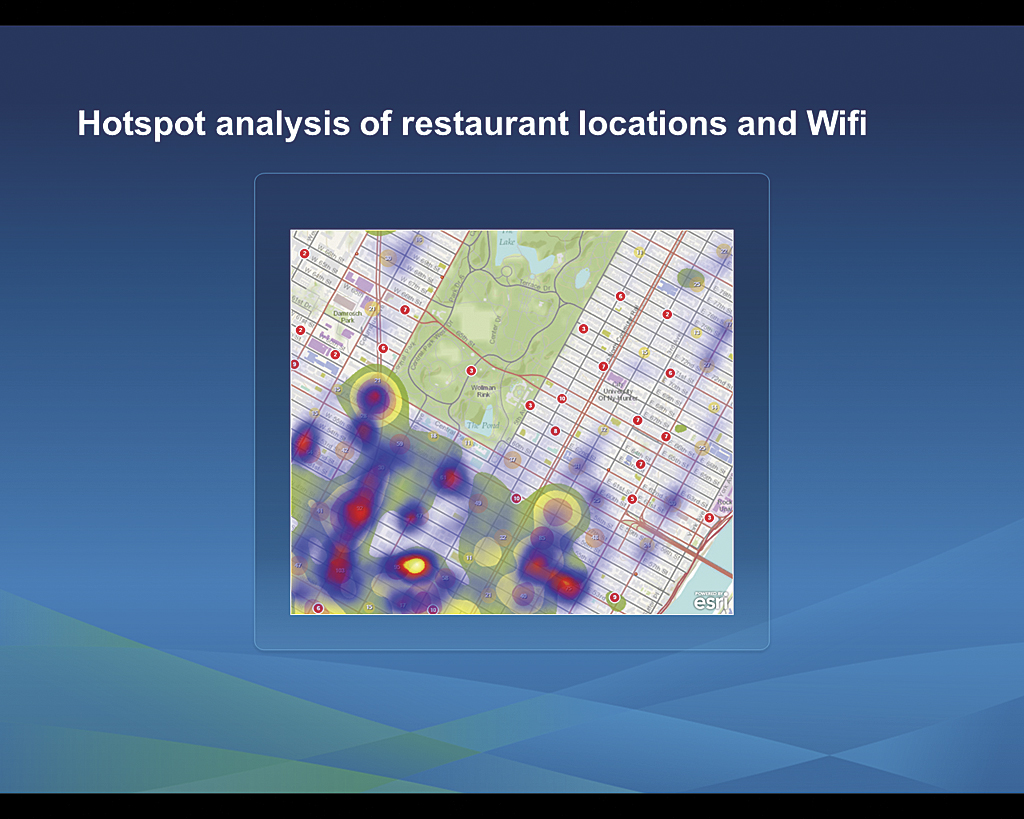
Point density can be represented as a heat map. Maps created with Excel data can be combined with map and feature services from ArcGIS Online. PowerPoint slides can be generated directly from Excel maps.
A Shortcut to Productivity
To get started, all that is required is Microsoft Office 2010 for Windows, an ArcGIS Online for Organizations subscription (either paid or trial), and the Esri Maps for Office add-in, which comes with the ArcGIS Online subscription. The add-in seamlessly embeds in Microsoft, installing its own ribbon in both Excel and PowerPoint.
With the add-in, hard-core business users can immediately start creating interactive maps in Excel by choosing the Esri Maps tab, clicking Insert Map, and accepting the default basemap or choosing another. Add Excel data from a table, named range, or cell range. If this data is associated with areas, such as countries, subcountry regions (in the United States, Canada, and western Europe), ZIP Code, or custom regions (supplied as feature services), color-coded maps of sales, customers, or other types of data associated with areas can be created.
Locating data as points on a map is simple but remains very useful. Esri Maps for Office can geocode by address, ZIP Code, state, and country. The symbology of Excel data points can be manipulated in terms of marker style, color, size, and grouping. Esri Maps for Office handles point data intelligently. Tightly spaced points are dynamically clustered. Dynamically clustering aggregates points as a single symbol at a small scale, but aggregated symbols separate when selected. At larger scales, points are displayed as individual symbols. Point density can also be represented as a heat map.
Users can use Search to locate map services or feature services on ArcGIS Online. They can choose services added by your organization or some of the thousands of services contributed by other organizations. Having everyone use data layers that are centrally maintained by your organization ensures that the most current data is being used for analyses and presentations. Content created using the Esri Maps for Microsoft Office add-in can be added to ArcGIS Online maps or shared back on ArcGIS Online for use by others in mashups.
Like other maps on ArcGIS Online, maps created with this content can be used by a mobile device (smartphone or tablet), embedded in a web page, shared via social media such as Facebook or Twitter, or converted to a web application. As the GIS manager, you maintain control over who can access, use, or contribute to the content you maintain on ArcGIS Online through assigning roles (i.e., user, publisher, administrator).
PowerPoint slides with interactive maps can be created from inside Excel and placed directly into an open PowerPoint file. Alternatively, web maps located on ArcGIS Online can be placed in a PowerPoint presentation by simply clicking the Add Map Slides button on the Esri Maps ribbon in PowerPoint. Maps can also be shared as static images.
Language support is provided for Arabic, Chinese (simplified), English, French, German, Italian, Japanese, Portuguese, Russian, and Spanish.
A Complete Geospatial Platform
With the Esri Maps for Microsoft Office add-in, non-GIS users can take advantage of geointelligence without changing the way they work and without making more work for you and your staff. They can use your work, their work will be accessible across many platforms, and they will feed content back into your system, further integrating GIS into business systems and leveraging the organization's GIS assets. For more information, visit esri.com/software/esri-maps-for-office.