ArcWatch: Your e-Magazine for GIS News, Views, and Insights
March 2011
Volunteered Geographic Information Plays Critical Role in Crises
Redlands GIS Week

Esri created an Egypt Events Map, which pulled in social media feeds about the antigovernment protests. That map was quickly replaced by the Middle East Protests Map.
While a political revolution swept through Egypt, led by protesters who organized via social media, Redlands GIS Week attendees met at a workshop to explore the future impact of social media and volunteered geographic information (VGI), especially during crises and emergencies. More than 100 academics, students, government and private sector experts, and Esri employees attended the workshop Volunteered Geographic Information: Real-Time and Emergency Applications during GIS Week, which was held February 8–10, 2011, at Esri headquarters in Redlands, California. The event was cosponsored by the University of Southern California Spatial Sciences Institute, the University of Redlands, and Esri.
VGI, or locational crowdsourcing—where citizen volunteers contribute data that's georeferenced, then disseminated—is particularly useful in emergency applications because the information's timeliness is especially valuable. For example, Esri created the online Egypt Events Map just after anti-government rallies began in Tahrir Square, Cairo, on January 25, 2011. The map, now called the Middle East Protests Map, pulled in social media related to the protest in real time. Though only a few Twitter, YouTube, and Flickr posts appeared initially because the government shut down the Internet early on, the number expanded as restrictions eased.
It's About Time
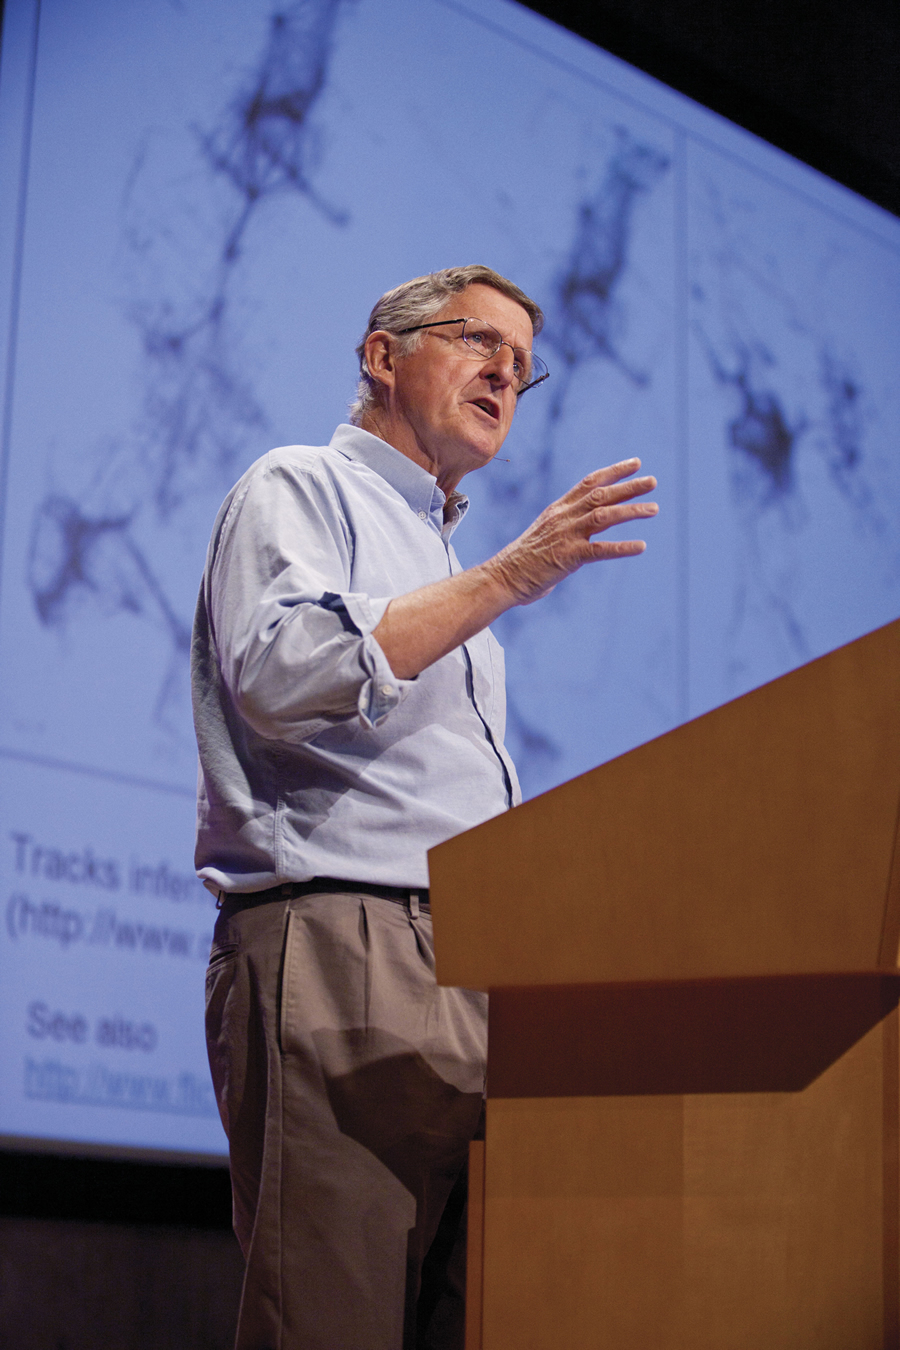
In his keynote speech, It's About Time: The Temporal Dimension in VGI, geography professor Michael F. Goodchild from the University of California, Santa Barbara, stressed the importance of time in VGI to create an accurate picture of what's occurring and when in a particular situation. Maps have traditionally emphasized the static aspects of geography. "You did not make maps of things that were changing," he said. "But rivers change course, people move, events occur, and emergencies develop. Geography is dynamic."
Goodchild also examined the issue of the quality of VGI. VGI can readily claim to be the most current data source, as witnessed by Twitter's ability to break news before other sources. VGI, compared to traditional authoritative data sources, has been criticized for having poorer positional accuracy and overall veracity, Goodchild explained in his talk. However, that assertion is countered by citing Linus's Law, which states that the more people involved and watching over a project, the more likely errors can be spotted and fixed quickly. The law was named after Linus Torvalds, credited for initiating development of the Linux operating system. Examples of the self-regulating effect of crowdsourcing are open source software projects such as Linux and wikis such as Wikipedia. Another law at play with VGI is Tobler's Law, which states, "Everything is related to everything else, but near things are more related than distant things." This means that citizen contributions will tend to be more accurate for places that the contributor lives in and knows best.
Professor Michael F. Goodchild coined the term volunteered geographic information (VGI).
During emergencies, the value of VGI is in its currency and the broad coverage offered by volunteer citizen cartographers and citizen reporters. "The most compelling case for VGI is during emergencies," said Goodchild, adding that, with experts being sometimes scarce on the ground, it's important to turn to citizens who can contribute data through social media or other means. "We have seven billion intelligent observers on the planet."
Successful VGI Projects
Two rapid and very successful VGI deployments helped coordinate disaster response after a devastating magnitude 7 earthquake struck Haiti in January 2010.
OpenStreetMap (OSM) project volunteers working outside Haiti created a digital street map of Port-au-Prince and other places in Haiti very rapidly using fine-resolution imagery to trace vector maps of streets and other features. The Ushahidi Project was able to post appeals for help, translated from Creole into English by another group of online volunteers. Together, these VGI projects were instrumental in guiding first responders to disaster victims.
At the workshop during Redlands GIS Week, Anahi Ayala Iacucci, from the International Network of Crisis Mappers (and an Ushahidi collaborator), presented Introducing the Standby Volunteer Task Force: An Online Community for Live Crisis Mapping. She explained how the digital response to the disaster in Haiti was organized. Iacucci stressed that volunteers need not wait until the next crisis happens to start creating and publishing VGI. People should work together right now to start collectively mapping poorly mapped regions at risk, she said.
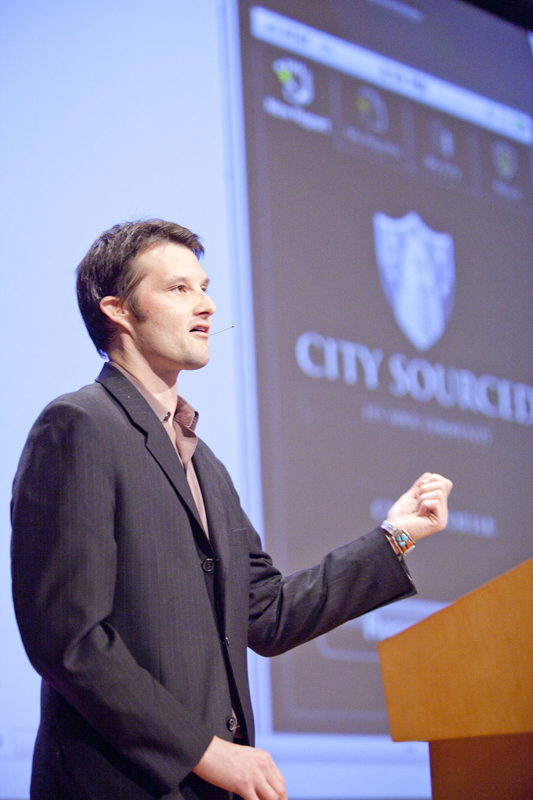
Kurt Daradics, cofounder of CitySourced, spoke about how the CitySourced application uses VGI.
Iacucci acknowledged Esri's participation in many of the volunteer efforts as well as in helping Ushahidi publish geodata. She also called for a stronger awareness campaign about the tools Esri offers to assist volunteers.
Kurt Daradics, cofounder of CitySourced, spoke about his company's experience with VGI in his presentation, Using VGI to Mobilize Civic Engagement. CitySourced develops and markets software for mobile handsets and servers that connect citizen requests for service to public agency back-office work order systems. The company used Esri's ArcGIS API for iOS to develop its iPhone application, which lets citizens report problems such as potholes and graffiti to their local governments.
Daradics said that having citizens directly report neighborhood problems using applications on smartphones can reduce the cost of 311 call center systems significantly. By connecting to enterprise work order systems, an alert can be sent notifying the person who reported the problem that it had been resolved, thus increasing citizen trust in government.
Other notable speakers at Redlands GIS Week included Lorant Czaran from the United Nations Office for Outer Space Affairs (UNOOSA) in Bonn, Germany; Lars Bromley from the United Nations Institute for Training and Research (UNITAR) Operational Satellite Applications Programme (UNOSAT) in Geneva, Switzerland; Sentil Prakash Chinnachamy from Spatial Edge; and Joseph Toland from the United States Federal Emergency Management Agency (FEMA).
Toland said that FEMA is committed to including VGI in the mix of data sources used to provide common operating pictures for first responders. These capabilities are being built into the System Assessment and Validation for Emergency Responders (SAVER) system, which includes a map viewer built on ArcGIS API for Flex.

Redlands GIS Week focused on the use of VGI and social media to increase civic involvement and better respond to emergencies.
Mapping Disasters
Esri staff conducted several demonstrations, including one showing the interactive Gulf of Mexico Oil Spill map. The application, created in April 2010, after the Deepwater Horizon oil rig explosion, shows relevant VGI posted by citizens via Twitter, YouTube, Flickr, and Ushahidi. The application provides context to the VGI data by including map data supplied by authoritative sources.
Tom Patterson, Esri wildland fire specialist, spoke about his experiences breaking technical barriers in real-time mobile computing in the presentation Real-Time Mapping for First Responders. Patterson was dispatched to Louisiana with mobile GIS technology to help public safety response personnel as they tried to protect wildlife and natural resources after the oil spill. Patterson said that planning staff members, working in Emergency Operations Centers (EOCs) in five different states, were kept informed of oil spill conditions and the effects on wildlife by transmitting data collected in cellular dead spots of the Louisiana marshes through an Inmarsat Broadband Global Area Network (BGAN) terminal.
The BGAN device is a Wi-Fi-enabled, compact, portable data/voice satellite transceiver with global Internet coverage. Rugged PDAs running ArcGIS Mobile mapping applications could synchronize with an ArcGIS Server instance in Texas directly from impacted locations throughout the gulf. This was the largest deployment of mobile GIS technology used during any disaster response and recovery operation. "It demonstrated the capabilities of ArcGIS used as a complete system for data management, planning and analysis, field operations, and situational awareness," Patterson said.
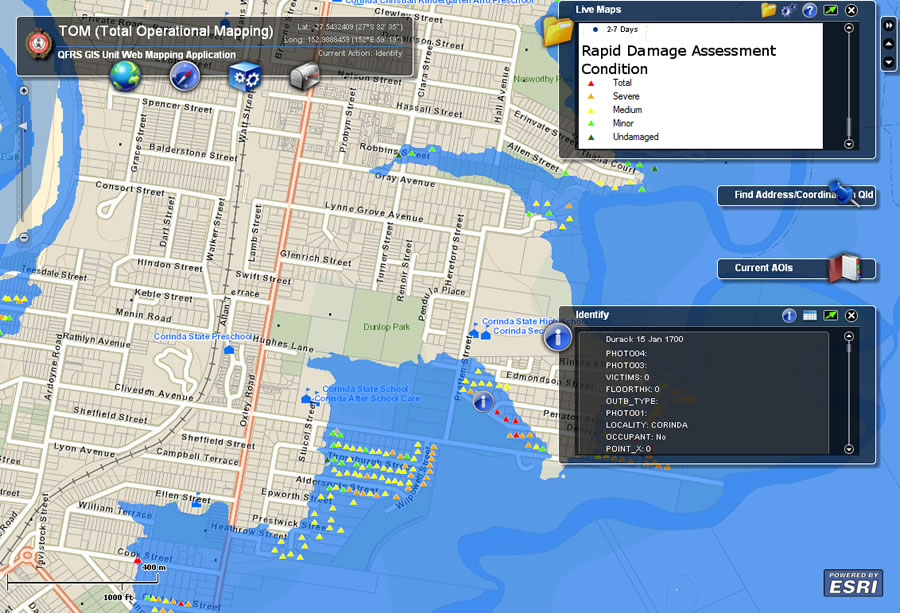
This web mapping application at the Queensland Fire and Rescue Service, powered by Esri technology, shows the peak flood boundary in Brisbane, Australia.
The 2011 floods in Queensland, Australia, and the subsequent Tropical Cyclone Yasi presented another opportunity for mobile GIS to prove to be the best solution in a complex situation, Patterson said. More than 75 percent of Queensland was affected by devastating flooding and the Category 5 cyclone. Together, these were declared to be the costliest disasters ever in Australia.
Queensland Fire and Rescue Service (QFRS) firefighters conducted rapid damage assessment inspections on 8,184 flooded properties using PDAs running ArcPad mobile mapping software. About 2,500 additional damaged or destroyed structures were mapped after Cyclone Yasi passed through. Esri's ArcGIS Mobile was used on both a Tablet PC and a PDA to map hazardous debris that floated downstream through Lockyear Valley as seen from a helicopter. (Watch the video.)
Condition reports of the structures and photographs of the damage were transmitted to fire planning officials, who used the information to prioritize recovery efforts.
Patterson said it was interesting, from a technical standpoint, to be able to remotely access from a Tablet PC the Total Operational Mapping (TOM) situational awareness Flex viewer that Brisbane State Operations Coordination Center (SOCC) was using and see the data updates. "We were synchronizing to the QFRS server and TOM via the Internet on the Tablet PC while flying in a helicopter 65 miles from the SOCC," he said. "We could also see the same map the decision makers were viewing. It was exciting to watch our updates, as they displayed in TOM, from the back seat of the chopper." The PDA was synchronizing to a server in the Amazon cloud.
Current events have proved the value of VGI in case after case. Nontechnical but involved people around the world know they can contribute to the public record, and the power and value of the VGI they produce will continue to influence world events.
For more information, visit redlandsgisweek.org.