Metro, the metropolitan planning organization for the Portland, Oregon, area, has been a GIS pioneer since 1990, when it began its GIS journey using Esri’s then-recently released ARC/INFO. Today, Metro—which manages Oregon’s land-use law in the area—and Portland’s regional government are nationally recognized leaders in government use of GIS.
Metro serves approximately 1.7 million people in the Portland area. With a jurisdiction that spans 24 cities and three counties, Metro brings together policymakers, planners, and the public to collaborate on projects that impact the entire region. One of Metro’s key goals is to democratize access to authoritative data, which the organization is now doing via ArcGIS Hub.

Need for Regional Map Data Kick-Starts GIS
In 1990, Metro was in the process of developing a regional growth strategy that would become known as the 2040 Growth Concept. This 50-year plan would promote a healthy economy, environmental sustainability, improved transportation systems, thriving neighborhoods, and secure housing for all.
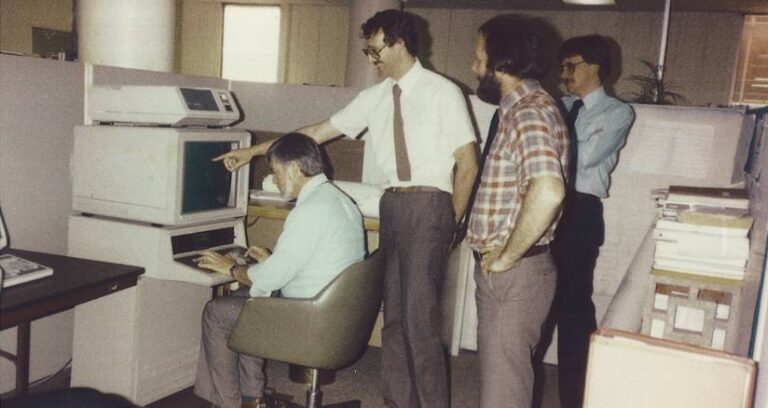
The staff at Metro realized that mapping data would be a crucial tool for planning and launching the 50-year strategy for growth. But up until then, detailed regional map data coverage didn’t exist. Metro turned to ARC/INFO, the first commercial GIS product of its kind.
“Metro saw this as more than just a way to create an internal data product,” said Julie Stringham, senior geospatial developer at Metro. “This was a way to kick-start GIS in the region.”
And kick-start GIS it did. Metro fully embraced the new tools offered by ARC/INFO, investing thousands of staff hours over a two-year period to create the initial 10 layers of map data. The result was that Metro boasted one of the first GIS programs in the country: the Regional Land Information System (RLIS).
Two Unique Ways of Collaborating
RLIS comprised more than just the data produced by Metro itself. The staff at Metro’s Data Resource Center reached out to regional partners and contributors to share data from a variety of local sources, creating a unique interjurisdictional collaboration with regularly updated regional coverage.
The agreement was simple. Contributing jurisdictions and organizations would have continuous free access to this collaborative regional data, and in return, they would each maintain their own features, lightening the load for Metro’s team.
This arrangement gave numerous partnering organizations access to high-quality data. But Metro didn’t stop there. In the late 1990s, Metro began making RLIS data available for purchase by users everywhere. Before the common availability of high-speed internet, this early arrangement required mailing quarterly data updates on discs to subscribers.
Today, RLIS is a collection of nearly 200 spatial data layers spanning the entire Portland metropolitan region. It has information ranging from aerial imagery and up-to-date street mapping to data on canopy cover and tax lots.
“Data drives everything we do. We collect, manage, and distribute the data we need,” said Christine Rutan, RLIS enterprise data lead at Metro. “But we’re not just publishing data; we’re delivering it in a way that lets people gain insight into our region and plan wisely for its future.”
One Place to Access Data
By 2010, Metro was ready to transition from delivering data by mail to distributing it online. Staff at the Data Resource Center developed a custom website, built using Adobe ColdFusion, that allowed RLIS subscribers to download shapefiles from any layer in Metro’s catalog, as well as access documentation and metadata—all in one place.
Soon, Metro was also using ArcGIS Server to publish data to web services. This enabled staff to provide updates and corrections to data as needed and allowed users to access data anytime, without having to download new data each quarter.
These improvements enabled Metro to discontinue producing physical data in the form of CDs or DVDs, saving the organization thousands of dollars in resources. They also made it possible over the following decade for Metro to provide an increasing amount of information as open data.
“Other jurisdictions started telling people to get their data from us,” said Rutan. “Through the website and the open data, people were engaging with a local government agency that they might not have known about before. RLIS became another tool for Metro to connect with residents.”
After a decade, Metro discovered that its data had been downloaded 45,000 times during 2021 alone. Everyone—from government agencies and nonprofit organizations to private companies and even students—was using Metro’s RLIS data to apply GIS to everyday problems.

Reinventing GIS Once Again, Online
By late 2021, the GIS team at Metro realized that it was time for another upgrade. Users needed the spatial data to be easier to access online, and the server that Metro was using had become outdated, presenting the organization with a security risk.
After researching its options, Metro reinvented its GIS once again, publishing all its mapping data to ArcGIS Online and transitioning RLIS to a new website, known as RLIS Discovery, that was built using ArcGIS Hub.
“We chose ArcGIS Hub because we had this new array of demands, but we didn’t necessarily have the staff time to spin up a custom website again,” said Stringham. “We were looking for something that could do the heavy lifting for us. And out of the box, ArcGIS Hub met most of our needs.”
Deploying ArcGIS Hub gave Metro a way to easily host RLIS data online and store documentation. It also simplified the process of updating data and metadata, since this doesn’t require expertise in coding. By using ArcGIS API for Python as well, staff at Metro standardized the way RLIS data is displayed without having to retrain staff members or rewrite metadata.
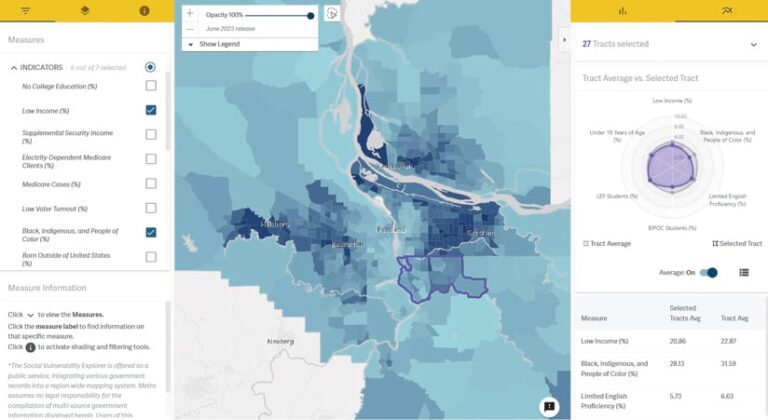
The agency has been able to apply its versatile and easy-to-use data in many innovative ways. Recently, in partnership with the Portland area’s Regional Disaster Preparedness Organization, Metro secured funding from the Department of Homeland Security to design a way for emergency planners to identify which communities lack adequate access to emergency services. A GIS analyst at Metro created a regional index for social vulnerability using 25 separate indicators drawn from the RLIS catalog.
“Our developers got to work building a web application,” said Stringham. “It uses [ArcGIS Maps SDK for JavaScript] and D3 [an open-source JavaScript library] to create a tool for emergency planners to go online and do exploratory data analysis. It helps us plan for emergencies, and it helps us reframe those efforts in a more equitable way.”
A Commitment to Democratizing Data Access
Metro is continuing its efforts to democratize access to information. It recently eliminated the annual RLIS subscription fee so that organizations of every kind can use comprehensive spatial data, regardless of their budget. This decision was made possible by Metro’s automated data processes and online data access.
“When we evolve alongside the rest of the GIS community, our success compounds,” said Stringham. “Data is really powerful, but it’s maps and dashboards that show us what the data has to say. By modernizing the way that we present our data, we’re making it easier for developers to give that data a voice.”

