In 2021, there were an estimated 247 million cases of malaria in the world, which resulted in about 619,000 deaths, according to the World Health Organization. Ninety-five percent of those cases and 96 percent of deaths related to malaria that year occurred in Africa.

Zambia, a landlocked country in southern Africa with a population of about 19.6 million people, is among the 20 nations in the world that suffer from the highest incidence of malarial infections and deaths. To implement programs to eradicate the disease from Zambia, the country’s ministry of health created the National Malaria Elimination Centre (NMEC) in 2016. In 2020, four technical partners joined forces to provide mapping tools and technical support to help the government distribute indoor residual spray and insecticide-treated nets.
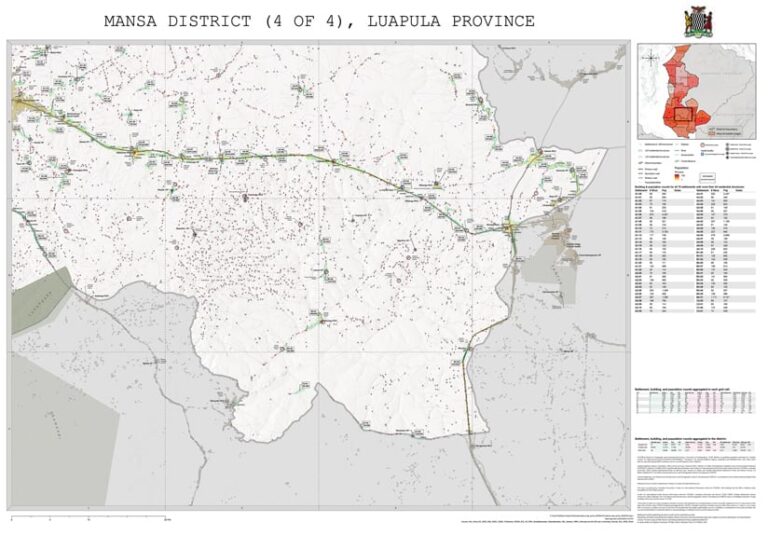
Using ArcGIS technology, the partners—which included spatial data solutions company Geo-Referenced Infrastructure and Demographic Data for Development (GRID3); two data-driven health organizations, Akros and PATH (formerly known as the Program for Appropriate Technology in Health); and the US President’s Malaria Initiative—supported Zambia’s ministry of health in using geoenabled maps to enhance the government’s malaria eradication planning and resource allocation. High-resolution population data and georeferenced settlement, health facility, and other points-of-interest data—all of which was generated by GRID3—was used to create these maps. The government was then able to use the maps during microplanning sessions, wherein teams in local districts ensure that their areas have the appropriate resources for each vector control intervention.
Developing Grids and Creating the Atlas
GRID3—the geospatial technical partner on the project—works with government organizations throughout sub-Saharan Africa to generate, validate, and use geospatial data. The organization’s core geospatial data products include datasets on population, settlement, infrastructure, and boundaries.

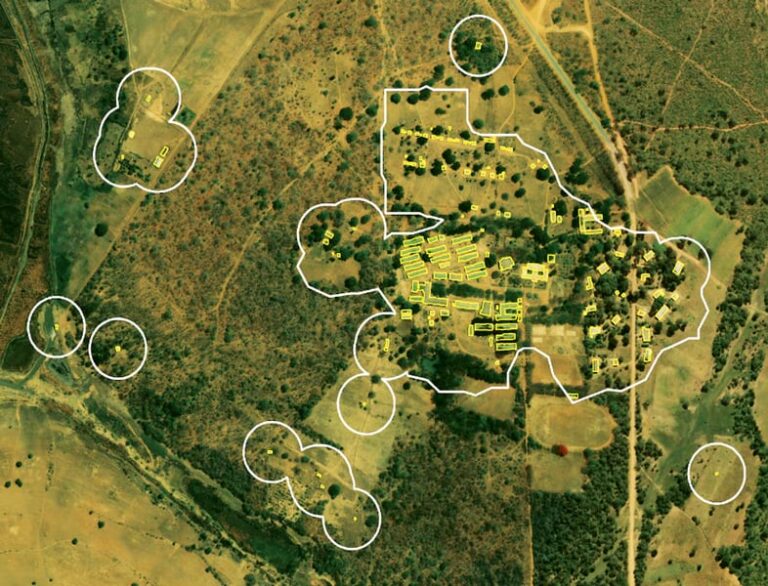
Working in close collaboration with the other technical partners on the Zambia project, staff members at GRID3 used ArcGIS Pro and ArcPy to create a national atlas of microplanning maps to help Zambia’s government plan its vector control campaign. The team employed GRID3’s high-resolution gridded population estimates, settlement extents, residential structure counts, administrative district boundaries, and the locations of key landmarks such as health facilities and schools. In addition, the team at Akros further refined its estimates on population and structure counts using field-verified data that Akros and Zambia’s ministry of health captured in previous years via Akros’s Reveal platform. The platform is a geospatial microplanning and data collection tool that field teams use to ensure that everyone targeted in a health campaign receives the service, whether it’s indoor residual spraying or mosquito nets.
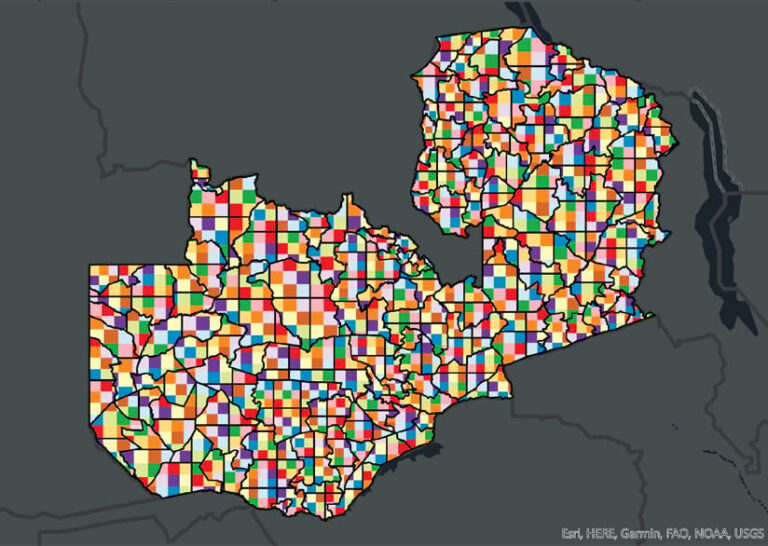
To create the atlas, GRID3 staff employed the Grid Index Features tool in ArcGIS Pro to divide each of Zambia’s 116 districts into a 289-cell static index grid. They used this index grid to determine the extent of each map page that would be included in the map series. The pages were set to a 4:3 (landscape) or 3:4 (portrait) aspect ratio to ensure that each map could be subdivided into equal-area grid cells.
Staff then employed the Grid Index Features tool again on the original index grid output to subdivide each map into a series of nested grids. This allowed the related tabular summaries of the grid features—which show the total estimated population and the estimated number of livable structures—to be included on the maps, enabling users to review the summary statistics of each subdivision within the map document. The team also included a terrain hillshade as an embedded basemap to provide users with additional spatial context, such as rivers, wetlands, and areas of high elevation, to help with planning efforts.
“The maps were used during the microplanning process to analyze the country’s population distribution at a granular level,” said Olena Borkovska, implementation lead at GRID3. “The gridded nature of the GRID3 population dataset provided flexibility in calculating the population in settled areas. It presents a detailed picture of where people in Zambia live and can inform which vector control method can best be optimized, considering the dispersed population, resources, and costs.”

Detailed Maps Lead to Action
The partners provided digital and print copies of the resultant maps to government staff members at district health offices to help guide the vector control planning process. District planners appreciated the granular data on the maps, the consistent process for developing them, and the fact that the maps were available electronically and in print.
“The GRID3 maps were useful in our preparation and planning because they show all the facilities and the structures in the area,” said Beauty M. S. Pallu, the malaria elimination officer for the Chongwe district in Zambia. “Using this information, we were able to select where to put up depots and wash bays that are optimal for operational indoor residual spray activities and determine the number of resources needed at each location. We are also able to estimate how many structures to spray in a particular area.”
In 2020, 112 out of Zambia’s 116 districts used the maps during NMEC-led microplanning sessions to improve resource estimates for distributing indoor residual spray and insecticide-treated mosquito nets. According to Akros, use of the maps also helped minimize the overlapping deployment of indoor residual spray resources and mosquito nets to the same areas—one of the major goals of NMEC’s 2020 vector control strategy.
The maps were updated in 2021 and used to support malaria eradication efforts in Zambia in 2021 and 2022.

Equipping Governments with Geospatial Data
The operational data developed for this project was done in collaboration with Zambia’s National Spatial Data Infrastructure (NSDI) Steering and Technical Committees, as well as other government agencies, including the Zambia Statistics Agency, the Ministry of Health, the Ministry of Education, and the Ministry of Lands and Natural Resources. It is now being used for other Ministry of Health programs, such as immunization planning, and can be employed in other government-led health interventions throughout the country.
And this is just one example of GRID3’s efforts to support national governments in collecting, producing, and maintaining geospatial data for health-related interventions, according to Borkovska.
“In the past five years, GRID3 has seen a successful adaptation of core geospatial data layers and the use of GIS technology by governments in the Democratic Republic of the Congo, Nigeria, Zambia, Burkina Faso, Mozambique, Sierra Leone, and Kenya,” Borkovska said. “Government stakeholders are becoming better equipped with a sufficient understanding of GIS technology to use it in the decision-making process in the health sector.”

