Supply chain networks and airline companies analyze vast transportation networks to optimize their routes for speed, efficiency, and cost. Oil and gas companies need to account for the hidden risks associated with the types of equipment they use, the manufacturers they partner with, and the myriad conditions they operate in. And in a world of ever-growing e-commerce, marketplaces and financial institutions need to be able to identify behaviors that might indicate fraudulent activity connected to any of the countless transactions they oversee in a day—and they need to do it quickly.
To manage such complex issues, it is invaluable to be able to conduct graph-based analysis. Knowledge graphs connect data from multiple sources and generate traceable networks of relationships among different entities, revealing patterns that would otherwise be difficult to discern. And now, Esri offers a knowledge graph-based analytics product that users can implement in their ArcGIS Enterprise 10.9.1 environments: ArcGIS Knowledge. This new product enables users to connect ArcGIS Pro to Esri’s enterprise graph data store to visualize spatial, nonspatial, structured, and unstructured data in multiple ways—in maps, link charts, cards, histograms, and more.

A Use Case for Knowledge Graphs: Tracing Food Contamination
To illustrate the value of ArcGIS Knowledge, consider a hypothetical use case in which a local health department needs to investigate several reports of food contamination in a small town. Using knowledge graphs, public health officials can create associations among the reports and trace the contaminated food through the supply chain and back to its point of origin. This can be done by learning about the four central components of ArcGIS Knowledge: entities, relationships, maps, and link charts.
Entities
An entity is a type of item in a knowledge graph, such as a person, building, or vehicle.
To record a case of food contamination in ArcGIS Knowledge, a public health official would note a person’s report of foodborne illness and document any restaurants associated with that, along with the menu items the person ordered and the ingredients in those dishes. Each of those would be its own entity. The public health official would repeat this for each subsequent report of foodborne illness. This allows staff members at the public health department to drill down into which restaurants served menu items that might have been contaminated.
Relationships
In ArcGIS Knowledge, a relationship is an association that connects two entities.
A reported case of foodborne illness can be connected to the various restaurants that the person recently visited, the menu items the person ordered, the ingredients included in those menu items, and the suppliers of those ingredients. Being able to see this information graphically can elicit connections that otherwise might not have been obvious. For example, health department officials could see that one person who reported a foodborne illness went to a restaurant and ordered a salad with lettuce, tomatoes, and carrots in it, and that another reporter had a bacon, lettuce, and tomato sandwich from a different restaurant. Perhaps there’s a connection among those ingredients.
Maps
For entities that are associated with a location, ArcGIS Knowledge allows users to add these to a map. This can reveal spatial relationships that might not be apparent in a nongeographic view.
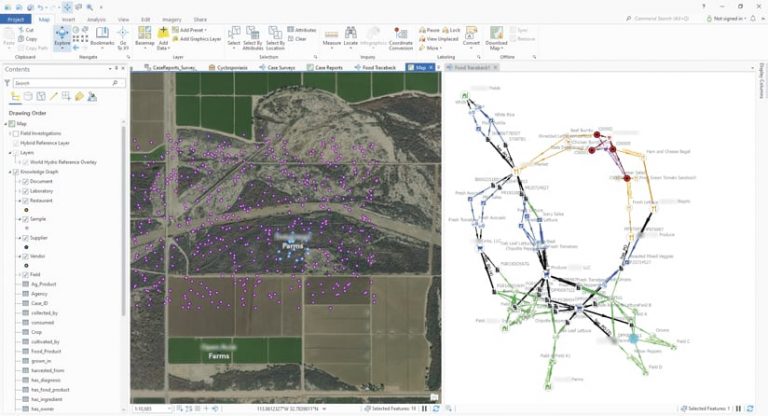
In the hypothetical food contamination example, analysts can plot on a map the restaurants that have reported cases of foodborne illness, the farms that supply those restaurants with ingredients, and where each farm’s crops are located to narrow down the geographic context of the problem. The map interface allows users to create new entities and edit the items’ properties. Once analysts have the entities spatially connected on a map, they can see where there might be clusters of entities associated with the problem—say, a vendor that supplies several restaurants in town with lettuce and tomatoes.

Link Charts
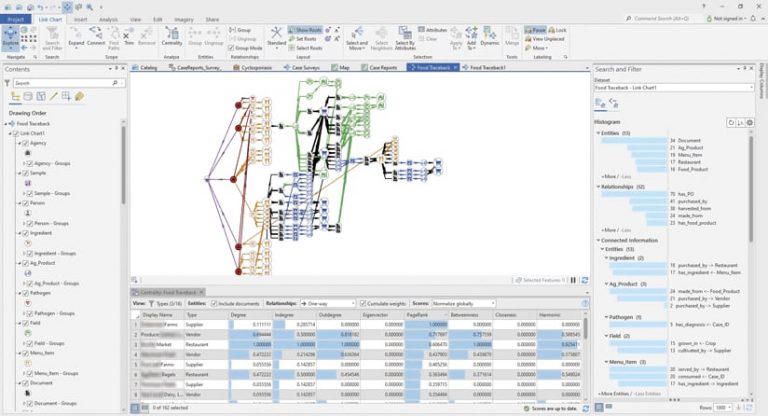
All entities and relationships can be added to a link chart in ArcGIS Knowledge. Link charts enable users to visualize how entities are connected, or linked, in a nongeographic view. This can help users determine associations among entities, such as finding a path through entities or determining which entities are central to the network.
In the hypothetical food contamination example, health department officials can use the link chart in ArcGIS Knowledge to visualize the supply chains associated with the reported cases of foodborne illness, from restaurant to menu item to vendor to farm to crop. So about those suspect veggies: based on the link chart, it looks like there might be a problem with some crops at a farm that provides lettuce, tomatoes, and other vegetables to a few local restaurants.
To sum up, using ArcGIS Knowledge, analysts at the local health department can investigate reported cases of foodborne illnesses as entities. They can store and display the entities in a graph network that shows their connections, or relationships, to other entities. From there, analysts can identify which restaurants are connected to the highest number of reports of foodborne illness and then further analyze the menu items and ingredients that those cases are related to. Once they identify common denominators, they can trace the ingredients back to food shipments, vendors, and farms, eventually finding the source of contamination, such as a common crop or storage environment.
Key Features of ArcGIS Knowledge
Several key features make ArcGIS Knowledge an asset to the decision-making process. Those features include the following:
- Connected data: By employing a shared graph store, users can more easily discover and connect data and contribute new information to reveal entities and the relationships among them. ArcGIS Knowledge makes it possible for numerous analysts to furnish and find data. All information in a knowledge graph is connected during the data creation process, which allows analysts to see data within the context of other data that an organization has.
- Turnkey graph data management: The graph store that deploys with ArcGIS Knowledge is fully integrated with an organization’s ArcGIS Pro and ArcGIS Enterprise investments. It facilitates efficient data storage and makes it easier to pinpoint relationships among entities.
Get Started
To learn more about ArcGIS Knowledge, sign up for product announcements. To add ArcGIS Knowledge to your organization’s ArcGIS Enterprise deployment, get in touch with an Esri representative.

